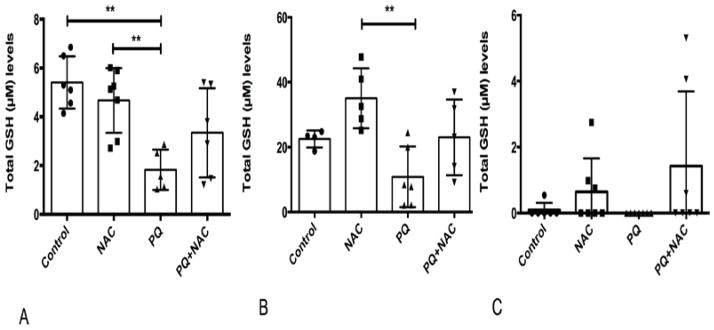
Figure 2.
Glutathione (GSH) levels (μM) of (A) liver, (B) brain and (C) lung tissue of mice. Bars represent mean ±1.96 (SD) with distribution of samples per group in scatter blot column. (A) Interval of confidence at 95% were as follow: Control: 5.40+/−1.96 (0.42), NAC: 4.66 +/− 1.96 (0.43), PQ: 1.82 +/− 1.96 (0.40), and PQ+NAC: 3.34 +/− 1.96 (0.55). The sample size of the experimental groups was as follow: Control (N=6), NAC (N=7), PQ (N=5), and PQ+NAC (N=6). (B) Interval of confidence at 95% were as follow: Control: 22.50 +/−1.96 (0.80), NAC: 35.03 +/− 1.96 (1.35), PQ: 10.86 +/− 1.96 (1.24), and PQ+NAC: 23.01 +/− 1.96 (1.52). The sample size of the experimental groups was as follow: Control (N=4), NAC (N=5), PQ (N=6), and PQ+NAC (N=5). (C) Interval of confidence at 95% were as follow: Control: 0.09 +/−1.96 (0.19), NAC: 1.60 +/− 1.96 (0.30), PQ: 0 +/− 1.96 (0) and PQ+NAC: 2.92 +/− 1.96 (0.56). The sample size of the experimental groups was as follow: Control (N=6), NAC (N=7), PQ (N=7), and PQ+NAC (N=7).

