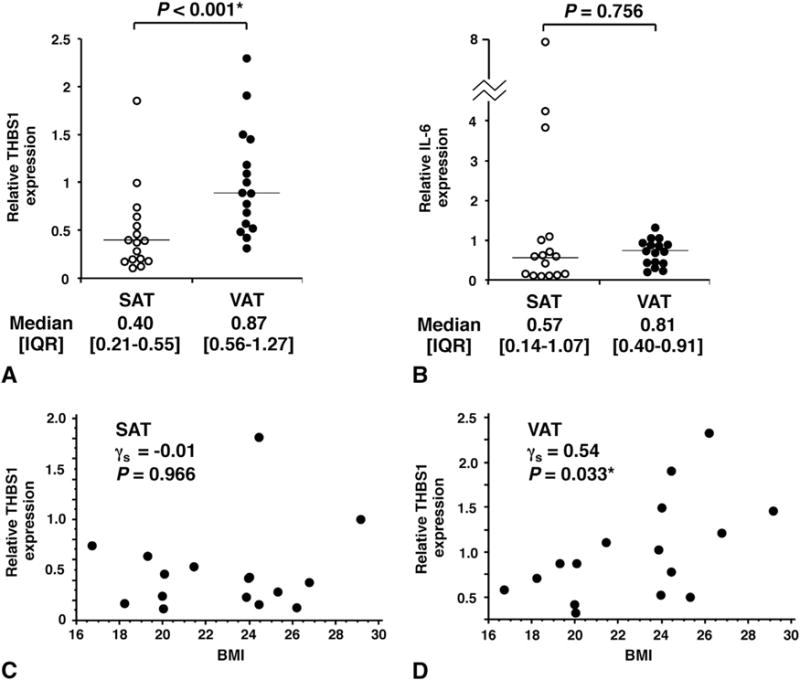
Fig. 1.

(A, B) The expression levels of THBS1 (A) and IL-6 (B) in human adipose tissues were quantified with real-time PCR. Data are expressed relative to the 36B4 gene used as an internal control for normalization. Horizontal bars represent median values. SAT, subcutaneous adipose tissue; VAT, visceral adipose tissue. The Wilcoxon signed-rank test was used to compare the difference in gene expression between SAT and VAT. (C, D) Correlations between THBS1 expression levels and obesity traits. Spearman’s rank correlation coefficient (γs) was used to determine the association of THBS1 expression with BMI in SAT (C) or VAT (D). *P < 0.05 (statistically significant).
