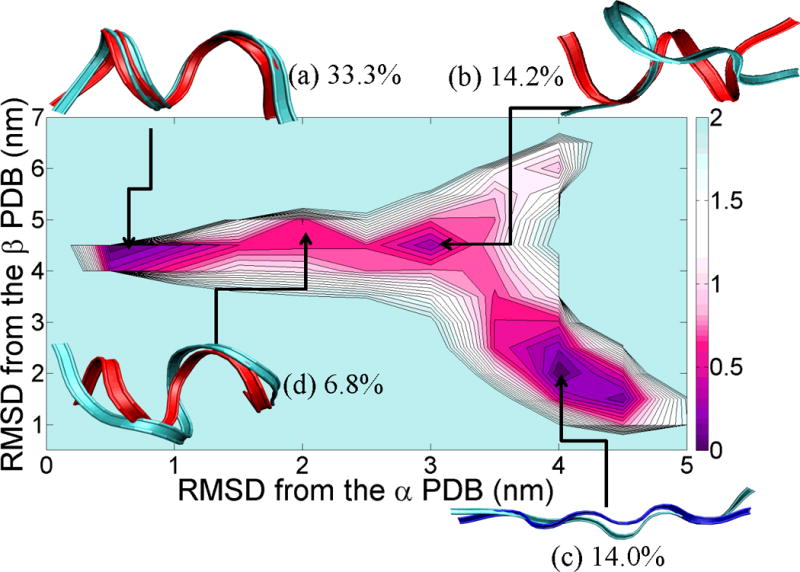
Figure 2.

PMF landscape of the chameleon-HS sequence fragment along with the result of cluster analysis. X-axis of the PMF graph is the RMSD (nm) from the reference α-helix fragment of the protein (shown in red color), PDB id = 1JIG and Y-axis of the PMF graph is the RMSD (nm) from the reference β-strand fragment of the protein (shown in blue), PDB id = 1P35. Each of the (a), (b), (c) and (d) structures reflected the lowest RMSD structure from each centroid and ordered by population (indicated as a percentage next to the letter label).
