Figure 7.

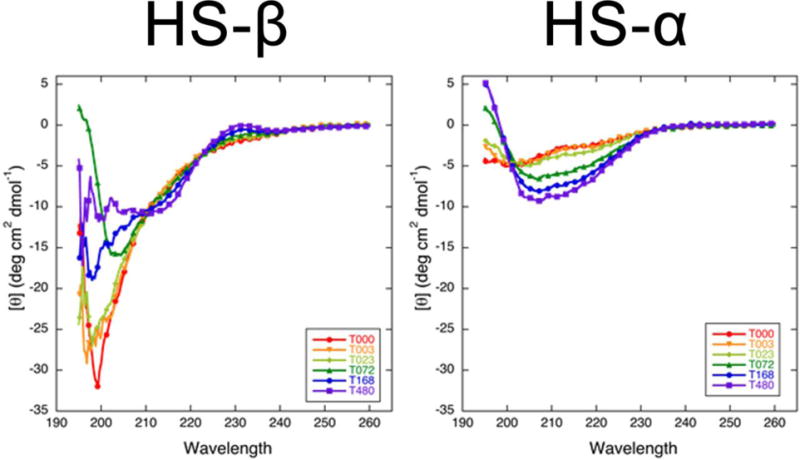
Time-course CD spectra of HS-β and HS-α in 20 mM ammonium acetate buffer. Different colors are used to annotate the spectra collected at different time points (e.g., T072 is the spectrum collected at t = 72 hours).

Time-course CD spectra of HS-β and HS-α in 20 mM ammonium acetate buffer. Different colors are used to annotate the spectra collected at different time points (e.g., T072 is the spectrum collected at t = 72 hours).