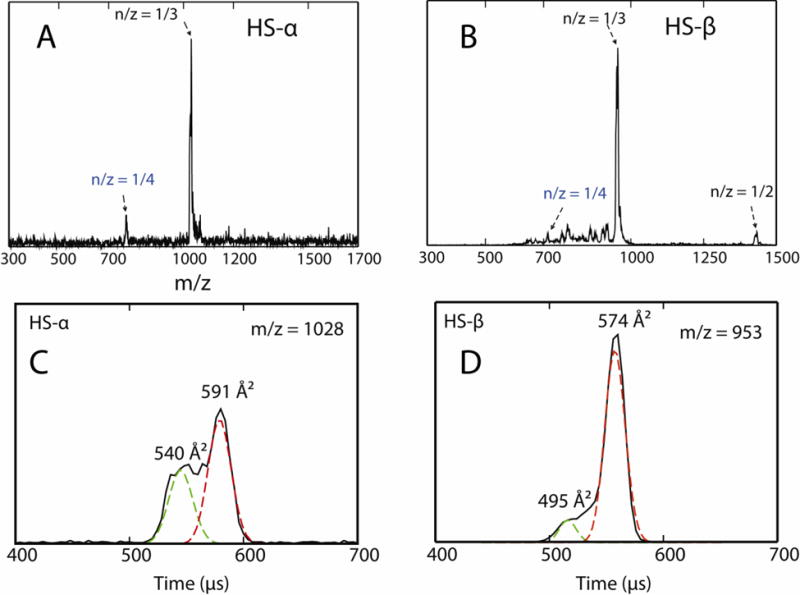
Figure 8.

(A, B) ESI-quadrupole mass spectra of 200 μM HS-α and HS-β in 20 mM ammonium acetate buffer. (C, D) Representative ATDs of n/z = 1/3 mass spectral peaks where n is the oligomer size and z is the charge. The experimental cross sections σ are shown.
