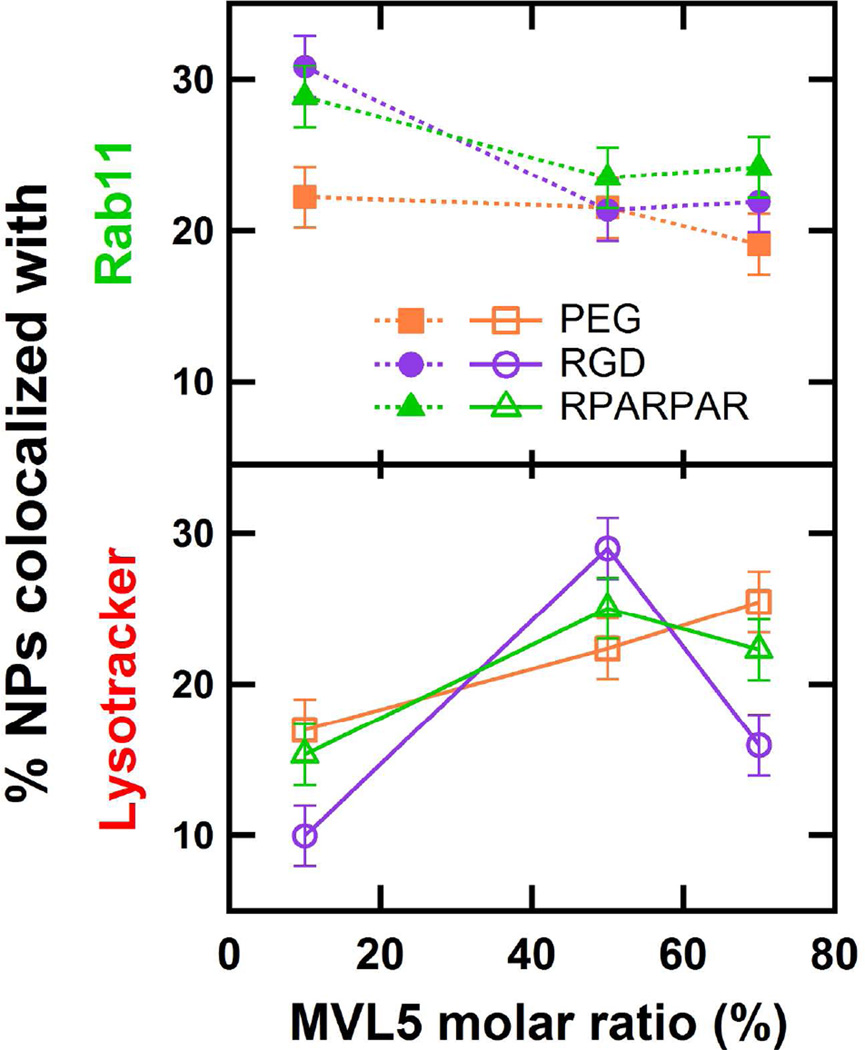
Figure 10.
Comparison of the colocalization of nanoparticles with endosomal markers. The percentages of NPs showing colocalization with Rab11 (top) and Lysotracker (bottom) were extracted from figures 7D, 8D, and 9D for control PEG-lipid NPs (orange), RGD-PEG-lipid NPs (purple), and RPARPAR-PEG-lipid NPs (green). Rab11 colocalization varies little with charge density for the control PEG-lipid NPs. Both RGD- and RPARPAR-PEG-lipid NPs show a decrease in Rab11 colocalization from low to high charge density and little change from high to very high charge density. The control PEG-lipid NPs show a monotonic increase in Lysotracker colocalization with charge density. Both RGD- and RPARPAR-PEG-lipid NPs show a large increase in Lysotracker colocalization from low to high charge density and a smaller decrease from high to very high charge density. RPARPAR-PEG-lipid shows a smaller range of colocalization with both Rab11 and Lysotracker compared to RGD-PEG-lipid.

