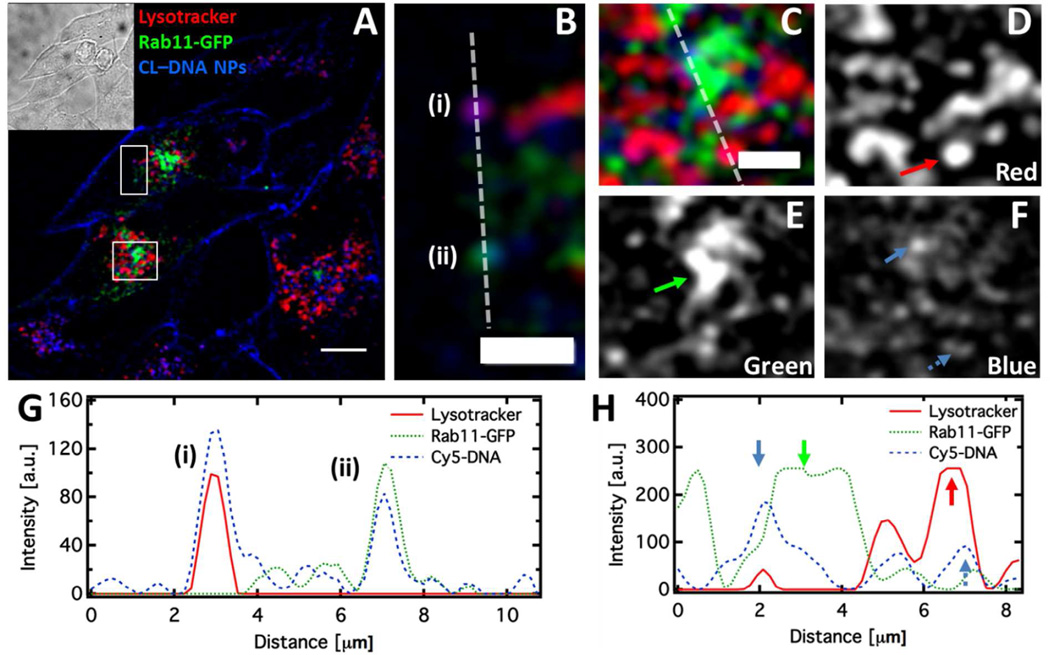
Figure 6.
CL–DNA NPs traffic through both recycling and late endosome/lysosome pathways. (A, B, C) Fluorescence micrograph and cropped regions of fixed PC-3 cells expressing Rab11-GFP (green), treated with Lysotracker Red (red) and incubated with 10/80/10 MVL5/DOPC/RPARPAR-PEG-lipid CL–DNA NPs (blue) at ρchg =5 for 5 hours. The inset displays the brightfield micrograph of the cells. (D, E, F) show the individual channels from (C) for clarity. (G, H) Intensity profiles of the dashed lines in (B) and (C). In (B) and (G), an acidic organelle (i) and a recycling endosome (ii), each containing an NP, are shown. In (C, D, E, F, H) the perinuclear recycling center (green arrow), a large, bright resolvable signal in the green channel, is shown containing an NP (solid blue blue). An acidic organelle containing a NP is also shown (red arrow, broken blue arrow). Scales bars in (A) and (B,C) are 10 µm and 5 µm, respectively.

