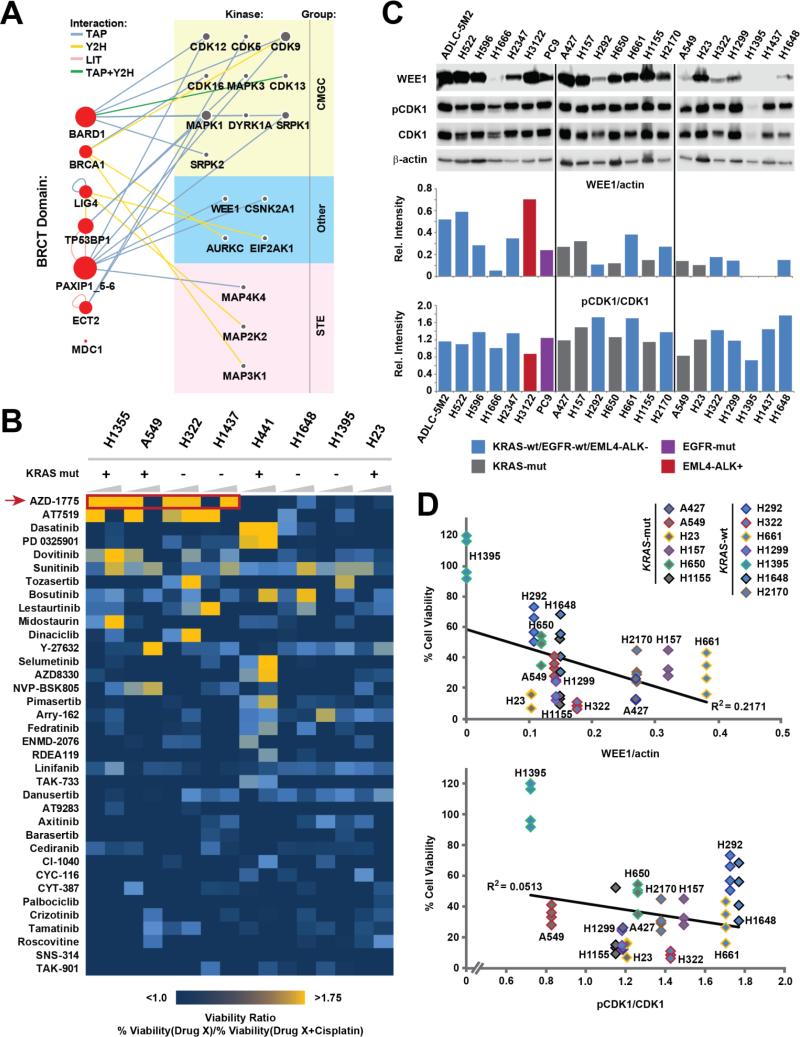
Figure 1. WEE1 was the top target from a pharmacological screen targeting DDR kinases.
(A) A previously generated protein-protein interaction network developed using seven tandem BRCT-containing proteins as baits (red nodes on the left) was used to identify seventeen kinases with a potential role in the DDR (grey nodes on the right). Kinases are grouped based on their classification; node size is proportional to the degree of interactions for each node, edges depict method(s) by which the interactions were identified (TAP: Tandem affinity purification, Y2H: Yeast 2-hybrid, LIT: Literature curation, CMGC: CDK, MAPK, GSK3 and CLK kinase family, STE: Serine/Threonine kinase family). (B) A 36 compound library targeting the seventeen kinases was used to treat lung cancer cell lines with a compound alone or in combination with cisplatin. The heatmap depicts the ratio of remaining cell viability upon treatment with each single library drug compared to treatment with the combination of that drug and cisplatin. Cell viability was determined after 72 h of drug treatment using the CellTiter Glo assay. Concentrations of library drugs were 0.5 μM and 2.5 μM (increasing wedges), the cisplatin concentration was 4 μM. A viability ratio above 1 indicates decreased cell viability upon treatment with the kinase inhibitors plus cisplatin when compared with treatment using the inhibitor alone. (C) pY15-CDK1 and WEE1 levels (top panel) in 21 untreated log growing lung cancer cell lines were quantified using densitometry analysis (bottom panel). WEE1 and pCDK1 levels were normalized using β-actin and total CDK1, respectively. (D) Lung cancer cell lines were treated with 2.5 μM AZD1775 and 4 μM cisplatin for 72 h and the percentage of viable cells was determined using the CellTiterGlo assay. Linear correlations (R2) between cell viability (quadruplicate analysis; all individual values shown separately) and expression of WEE1 (top panel) or pY15-CDK1 (bottom panel) are shown.

