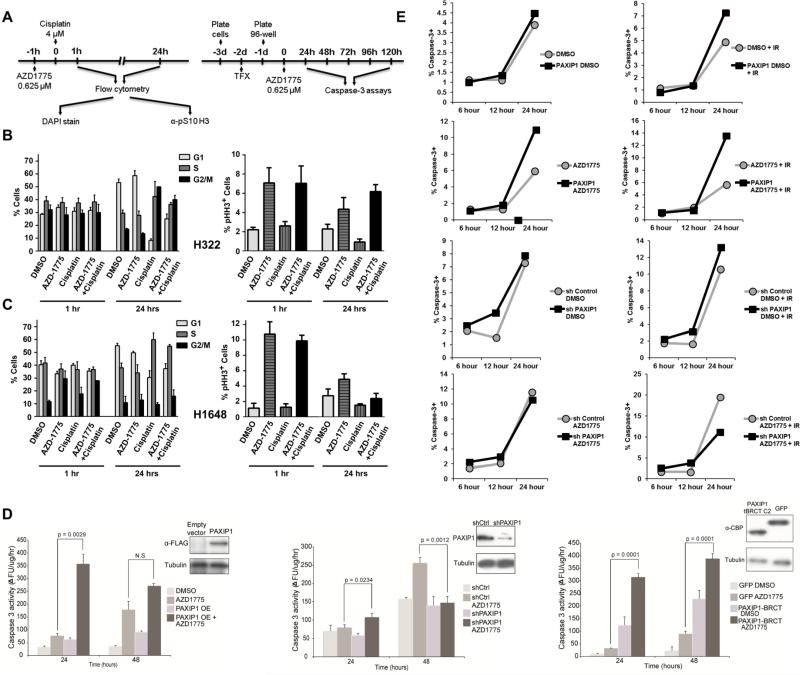
Figure 4. Effects of PAXIP1 levels on cell cycle and apoptosis responses upon treatment with AZD1775 and cisplatin.
(A) Experimental design timeline for cell cycle and apoptosis assays. (B-C) Effects of AZD1775 and cisplatin treatment in cells expressing high (H322) and low (H1648) levels of PAXIP1. Left panels depict cell cycle distribution using propidium iodide upon 1 and 24 h treatments. Right panels depict mitotic index as measured by the number of cells positive for pS10 Histone H3. Error bars depict standard deviation. (D) Caspase-3 activity was measured using a fluorometric assay after treatment with AZD1775 at the time points indicated in H322 cells overexpressing full length PAXIP1 (left panel), or with PAXIP1 knockdown (center panel), or overexpressing TAP-PAXIP1 tBRCT C2. OE: overexpressed, p < 0.05 considered significant using paired t-test. (E) In H322 with either PAXIP1 overexpressed or knocked down, percentage of caspase-3 positive cells (BV-605 caspase-3 positive) were measured using flow cytometry at the time points and conditions indicated. IR: Ionizing radiation.

