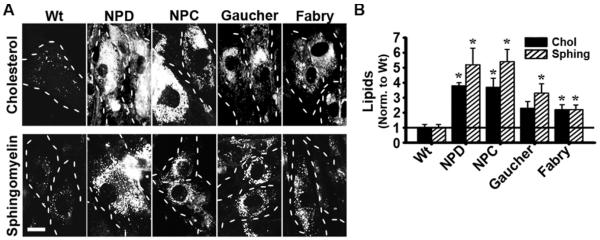
Figure 7.
Lipid accumulation in LSD fibroblasts. (A) Fluorescence images of wild-type (Wt), NPD, NPC, Gaucher, and Fabry fibroblasts incubated overnight with fluorescent BODIPY-FL-C12-sphingomyelin or stained with filipin, in order to visualize sphingomyelin and cholesterol, respectively. Dashed lines = cell borders, as observed from phase-contrast microscopy. Scale bar = 10 μm. (B) Quantification of lipid accumulation, normalized to that of Wt cells (horizontal bar). Data are the mean ± SEM. *Comparison with Wt (p<0.05 by Student’s t-test).

