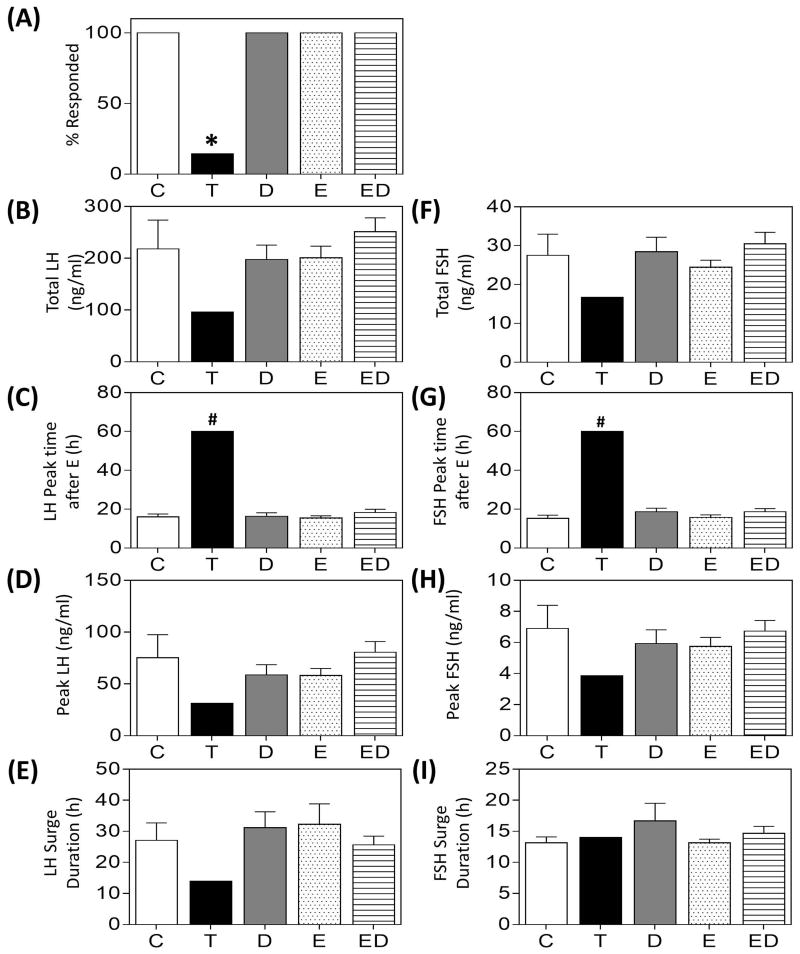
Figure 3.
Gonadotropin surge characteristics (mean ± SEM) during the E-positive feedback test in prenatal only treated groups. Observations in T-treated group are from a single animal that responded to the E-positive feedback challenge. Asterisks indicate significant difference from C and # indicates significant difference between the T-animal compared to the composite of all treatment groups (see statistical analysis for modeling).

