
Fig. 7.
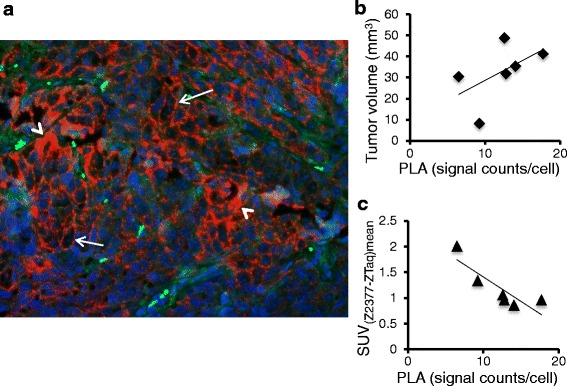
In situ PLA analyses of EGFR in formalin-fixed, paraffin-embedded sections of A431 xenografts from the longitudinal study. a EGFR-positive tissue, magnification ×20. White arrows and arrowheads indicate membranous and cytoplasmic patterns of EGFR immunostaining, respectively. Red dots: EGFR single proteins, blue: Hoechst nuclear staining, and green: auto fluorescence. b PLA signal counts/cell (relative EGFR expression level) in EGFR positive sections vs. volumes of the excised tumors. c Specific tracer uptake on the last day of imaging vs. the PLA signal counts/cell in excised tumor sections