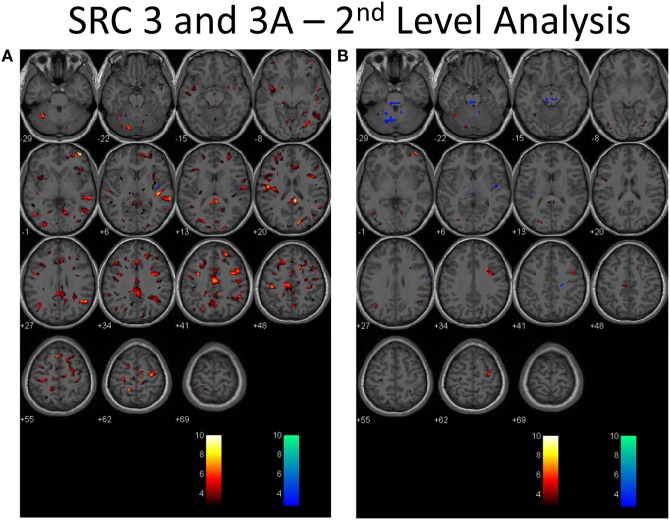
Figure 2.
Second-level analysis of longitudinal brain MRI CO2 stress testing in the same physiological post-concussion disorder patient illustrated in Figure 1 during the symptomatic (A) and clinically recovered stages of injury (B) compared with the stand-alone control atlas. Results are reported at the p = 0.005 level for cut-off of significant voxels (t-statistic value = 2.82 in this case). Hot color voxels (orangish hues) indicate where BOLD CVR response is significantly greater than the mean value for the collated control group images and the cool color voxels (blue hues) indicate where the BOLD CVR response is significantly less when compared with the mean value for the control group. The scale indicates the color scheme as expressed in t-values. This approach permits quantitation of the longitudinal differences evident to the eye as seen in Figure 1 to be displayed.

