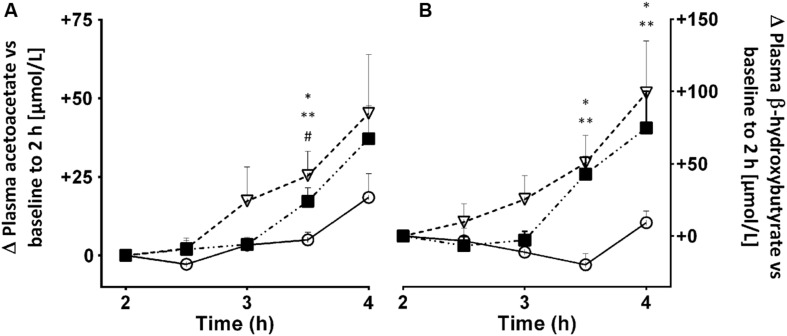
FIGURE 10.
Plasma acetoacetate (A) and β-HBA (B) 2–4 h after an oral dose of 2.5 ( ) or 5.0 mg/kg (
 ) of caffeine vs. no treatment control (
 ). Plasma caffeine reached a plateau 1–2 h after being consumed (data not shown), hence the reason for starting the ketone measurements at 2 h post-dose. Values are mean ± SEM (n = 10/point, with each participant undertaking each of the three treatments). Ketone data were normalized to zero at 2 h. ∗ Control vs. 2.5 mg/kg (∗p < 0.05) vs. 5.0 mg/kg (∗∗p < 0.05), and caffeine 2.5 vs. 5.0 mg/kg (#p < 0.05).

