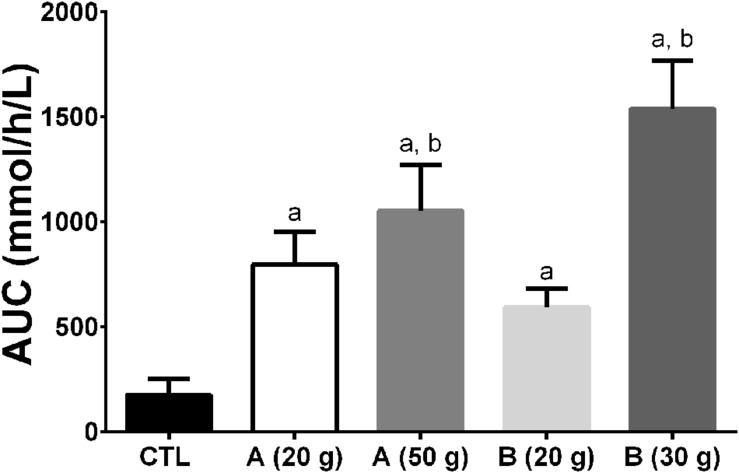
FIGURE 11.
Area under the curve (AUC) of plasma ketone response (beta-hydroxybutyrate + acetoacetate) after ingestion of two different MCT emulsions (A,B) during a 4 h metabolic study day. All the treatments differed from the Control (a – p ≤ 0.05). The 30 g dose of product B and the 50 g dose of product A differed from the 20 g dose of product B (b – p ≤ 0.05). Interestingly, the 50 g dose of product A gave a 40% lower AUC than the 30 g dose of product B demonstrating that different homogenates of MCTs can induce widely differing plasma ketone responses, at least in an acute study design. Proprietary considerations prevent providing a full description of products A and B.

