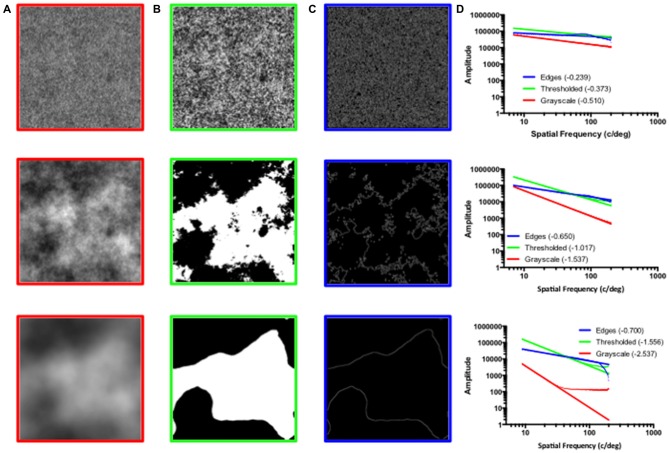
Figure 1.
(A) Grayscale fractal patterns with exponent values of 0.5 (top), 1.5 (middle), and 2.5 (bottom). (B) Black and white fractal patterns created by thresholding the grayscale patterns from the panel (A) at their mean luminance level. (C) Edges only patterns depicting the fractal boundaries created by extracting edges from the thresholded patterns depicted in the panel (B). (D) The amplitude spectra plots corresponding to the grayscale (red), thresholded (green) and edges only (blue) patterns; x-axis represents log spatial frequency while y-axis represents log amplitude. The lines (bold) are linear fits to the data (light).

