
Figure 13.
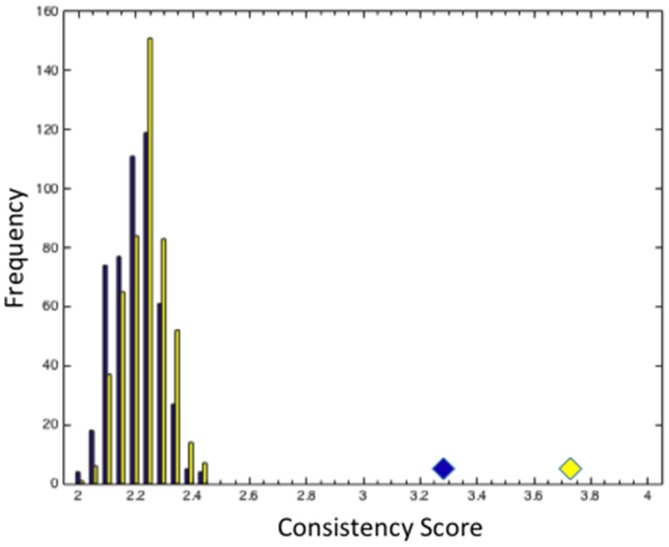
The distribution of consistency scores for 500 bootstrap simulations with randomly perturbed sub-group (yellow columns) or cluster (blue columns) membership. Blue and yellow diamond represent the average consistency scores for subjectively defined sub-groups and for clusters assigned by k-means analysis.