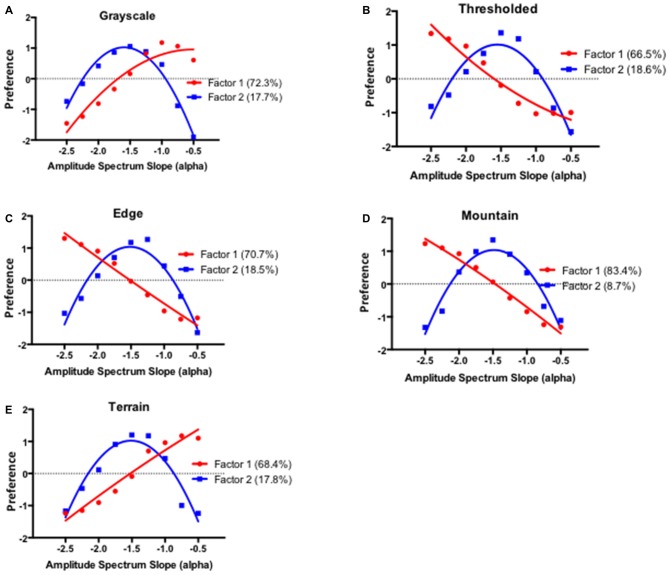
Figure 15.
Summary preference functions for the two factors resulting from the Q-mode principal component analysis for the grayscale (A), thresholded (B), edges (C), mountain (D) and terrain images (E) respectively. Percentages in each panel indicate the proportion of variance explained by each factor.

