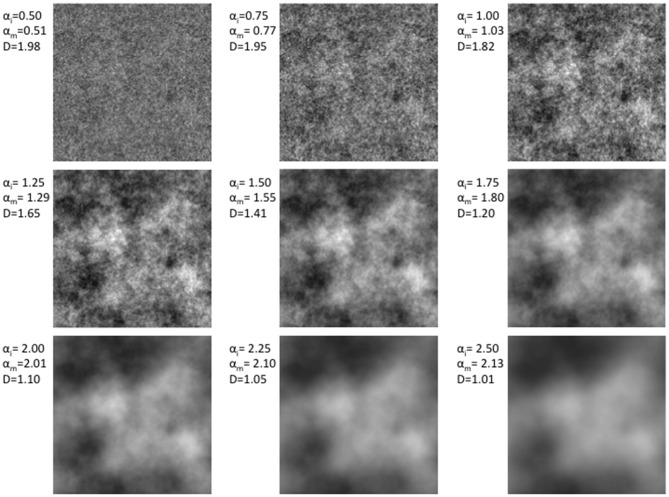
Figure 3.
Grayscale images varying in amplitude spectrum slope from 0.5 to 2.5 in increments of 0.25. The values next to each image show its respective amplitude spectrum slope used to create the grayscale image (top); its measure amplitude spectrum slope (middle) and its fractal dimension D determined by a box-counting procedure applied to the equivalent edge only images.

