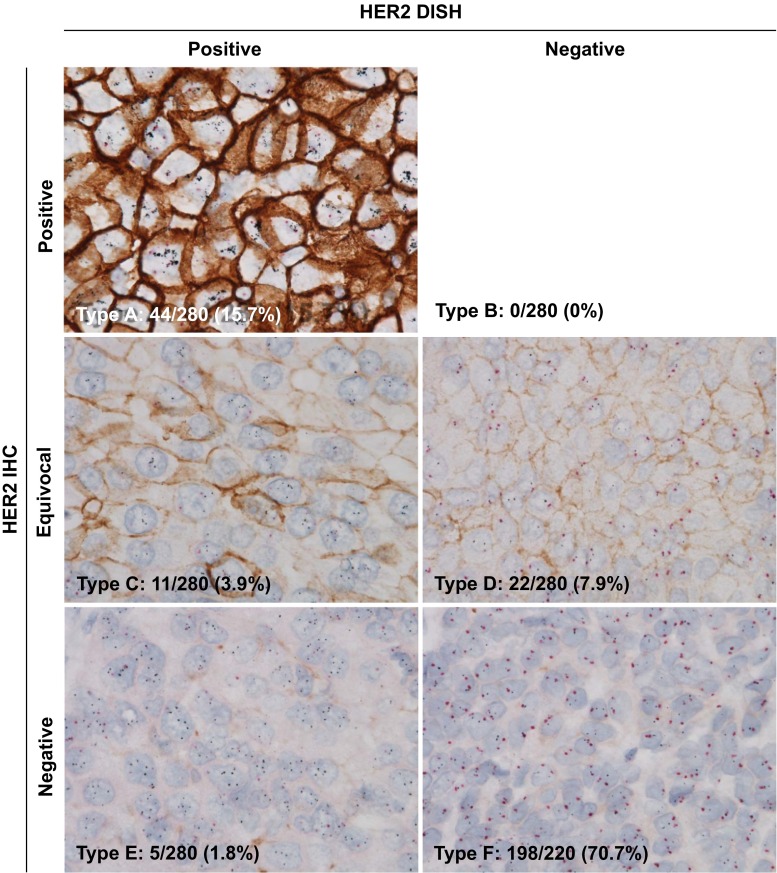
Fig. 1.
Phenotypic and genotypic human epidermal growth factor receptor 2 (HER2) pattern analyses of breast cancer by the HER2 gene-protein assay method (n = 280). Type A: HER2 immunohistochemistry (IHC) positive and dual in situ hybridization (DISH) positive (n = 44); Type B: HER2 IHC positive and DISH negative (n = 0); Type C: HER2 IHC equivocal and DISH positive (n = 11); Type D: HER2 IHC equivocal and DISH negative (n = 22); Type E: HER2 IHC negative and DISH positive (n = 5); and Type F: HER2 IHC and DISH negative (n = 198). Brown color indicates HER2 protein expression, black dots in the nuclei are HER2 gene, and red dots in the nuclei are chromosome 17 centromere

