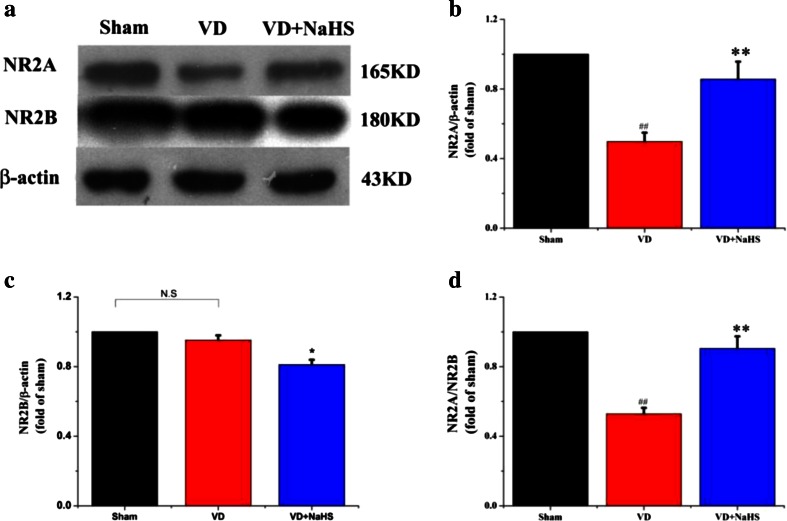
Fig. 5.
The expression of cognitive function associated protein detected by Western blot assay in hippocampus of the sham, VD, and VD+NaHS groups. a Quantitative analysis of protein expression of NR2A. b Quantitative analysis of protein expression of NR2B. c The ratio of NR2A/NR2B. Data are expressed as mean ± S.E.M. ## p < 0.01 comparison between the sham vs. VD groups. **p < 0.01 comparison between the VD+NaHS vs. VD groups. n = 4 per group

