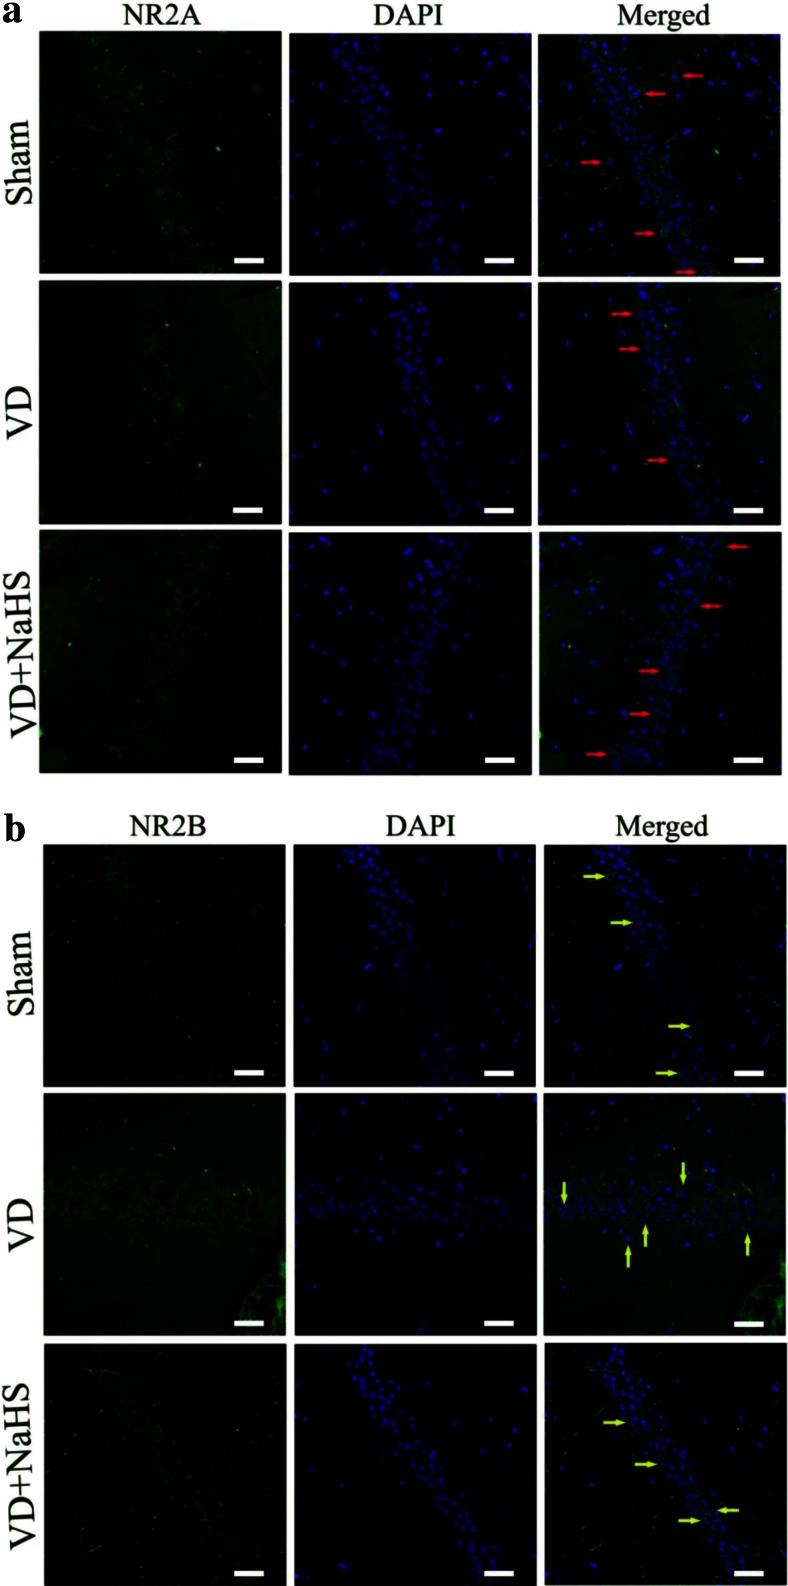
Fig. 6.
The expression of NR2A and NR2B detected by immunofluorescence staining (×400) in the CA1 region of hippocampus in the sham, VD, and VD+NaHS groups. Both of NR2A and NR2B were stained with green fluorescence by Alexa 488-conjugated anti-rabbit IgG. Nuclei of hippocampus were stained with blue fluorescence by DAPI. The protein expression of NR2A and NR2B were presented in the left columns, the morphology of nucleus was presented in the middle columns, and the merge pictures were presented in the right columns. Both NR2A and NR2B were presented by either green point shape distribution or a green ring around the nucleus in the left and right columns. Red arrow denotes NR2A expression in Fig. 6a and yellow arrow denotes NR2B expression Fig. 6b. Scale bar = 30 μm

