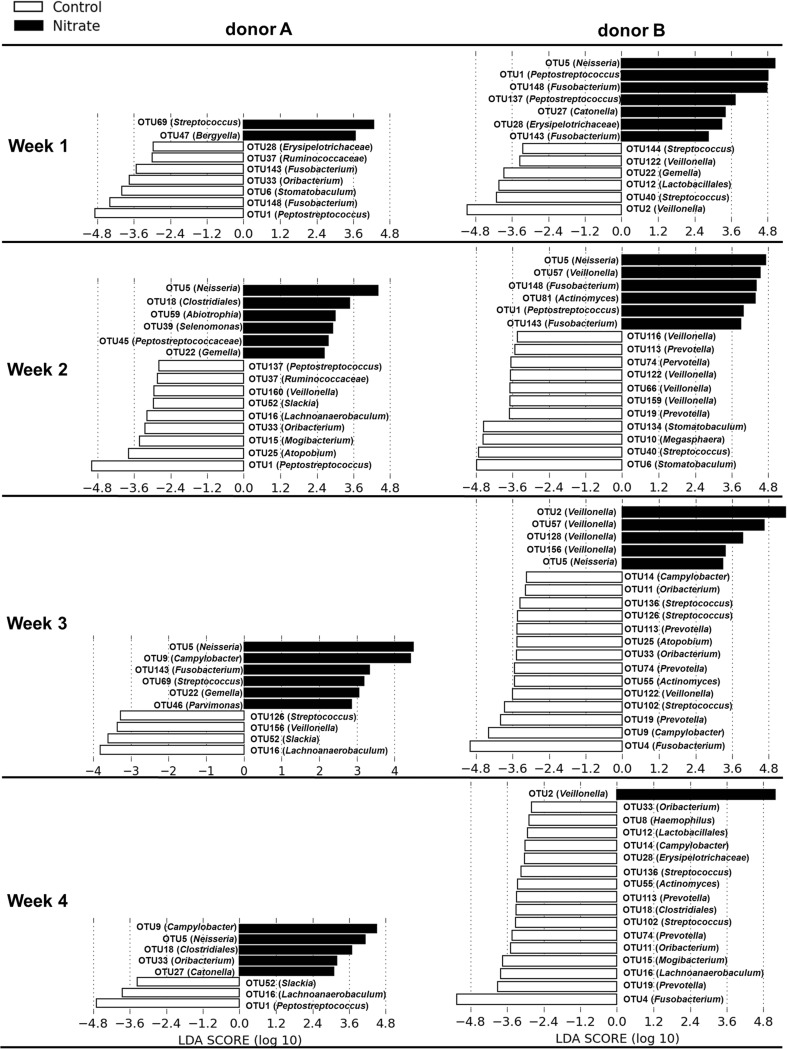
Fig. 4.
Differentially abundant OTUs between the two treatments at each time point per donor. The OTUs that were identified as differentially abundant through linear discriminant analysis effect (LEfSe) size score between the two treatments are displayed in the histogram. The white bars represent OTUs that were associated with the control group; the black bars represent OTUs that were associated with the nitrate group

