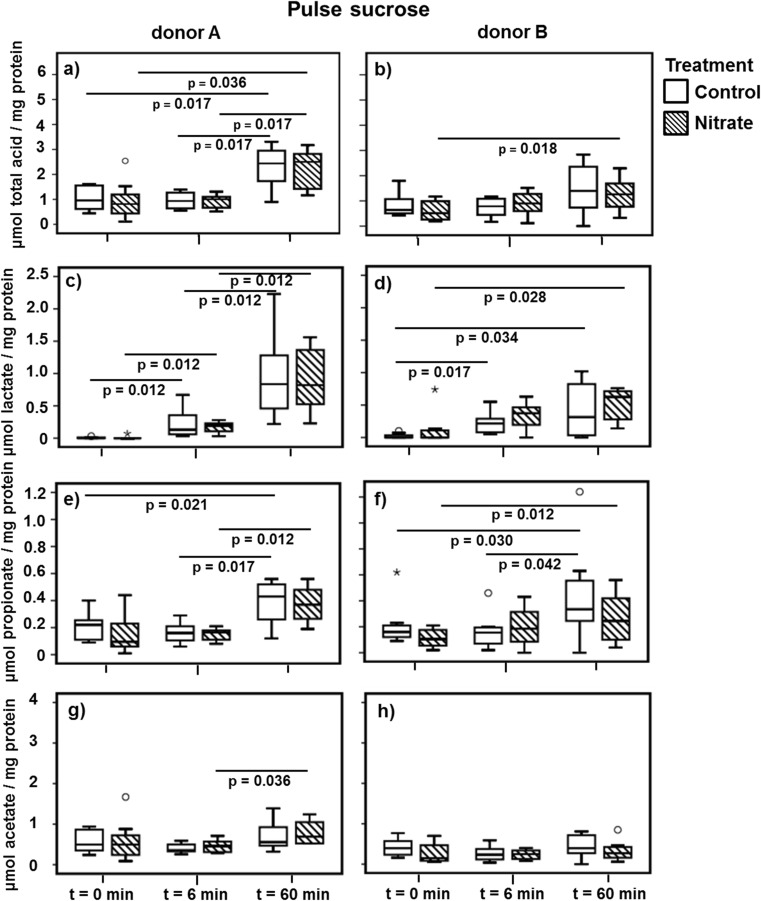
Fig. 6.
Short chain fatty acid concentrations before and after the addition of sucrose to the microcosms. The boxplots represent the concentration of all short chain fatty acids combined (a, b) (including succinate, formate, and butyrate), lactate (c, d), propionate (e, f), and acetate (g, h) before (t = 0 min) and after (t = 6 min and t = 60 min) the addition of sucrose. The significance (p < 0.05) of the difference in acid concentration between the time points of the same treatment was tested using the Wilcoxon signed ranks test. The boxes represent the median and interquartile range (IQR), and outliers more than 1.5× IQR are depicted by circles and more than 3× IQR by stars

