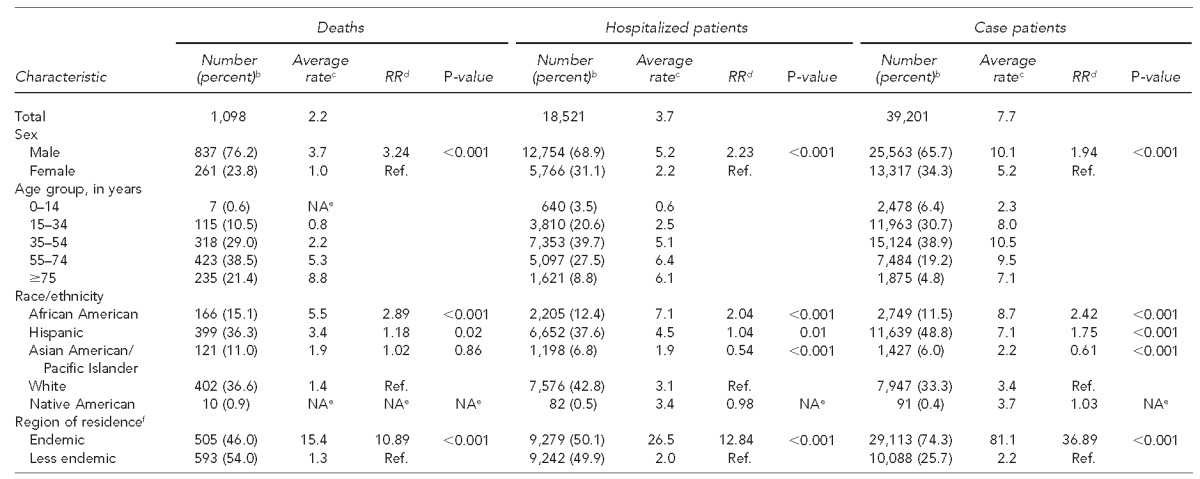
Table.
Characteristics of coccidioidomycosis-associated deaths, hospitalized patients, and case patients, California, 2000–2013a

Data sources: Death data: State of California, California Department of Public Health. Multiple cause of death files, 2000–2013. Sacramento (CA): California Department of Public Health; 2013. Hospitalization data: State of California, Office of Statewide Health Planning and Development. Inpatient hospital discharge data set. Sacramento (CA): State of California, Office of Statewide Health Planning and Development; 2015. Case-patient data: California Department of Public Health's coccidioidomycosis surveillance dataset.
bPercentages may not total to 100 because of rounding.
cAverage annual rates per 1 million population for death and per 100,000 population for hospitalized patients and case patients. Crude rates reported for age group. All other rates were age-adjusted to the 2000 U.S. standard population.
dRR calculated by Poisson regression
eBecause of small numbers, annual rates and RRs were not calculated.
fThe endemic region was defined as counties with annual case rates from the previous 13 years that were higher than the state rates of California (Fresno, Kern, Kings, Madera, San Luis Obispo, and Tulare counties). The less endemic region was defined as all other California counties.
RR = relative risk
Ref. = reference group
NA = not available or not applicable
