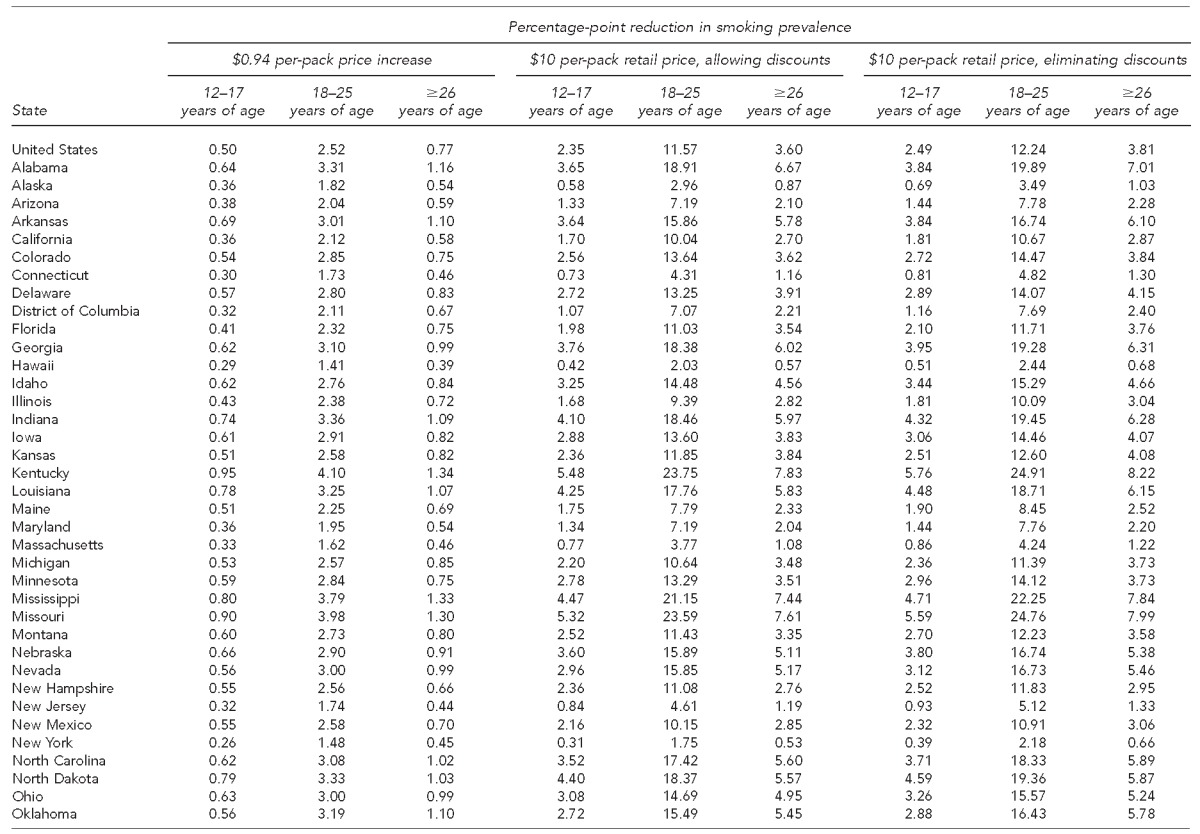
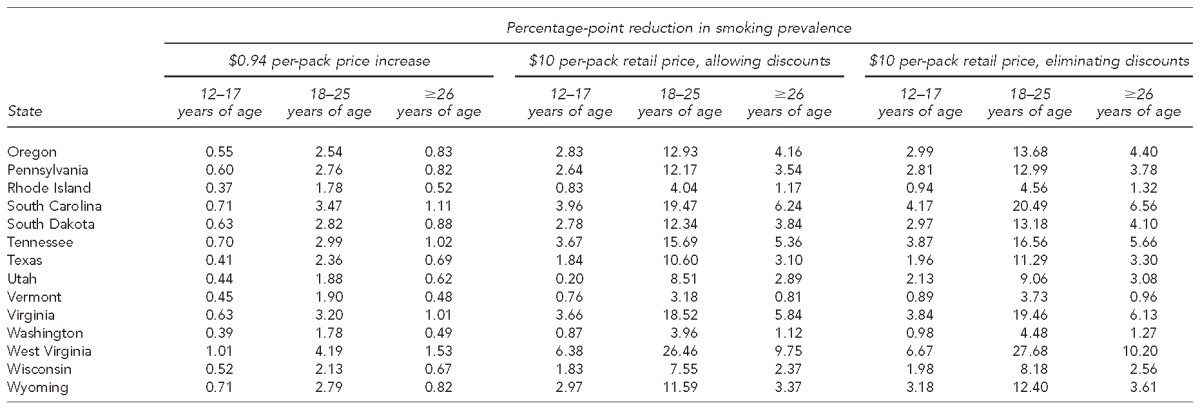
Table 1.
Projected reductions in cigarette smoking prevalence one year after implementation of three price scenarios, by age and state, United Statesa,b


95% confidence intervals are available from the author.
Reductions were estimated based on state-specific smoking prevalence from the 2012/2013 National Survey on Drug Use and Health. Average per-pack retail prices by state came from the 2010–2011 Tobacco Use Supplement to the Current Population Survey, adjusted to 2013 U.S. dollars. Price elasticity estimates by age group were obtained from a literature review by the Community Preventive Services Task Force. Data sources: (1) Census Bureau (US). Population estimates: historical data. 2014 [cited 2015 Jul 21]. Available from: http://www.census.gov/popest/data/historical/index.html; (2) Guide to Community Preventive Services. Reducing tobacco use and secondhand smoke exposure: interventions to increase the unit price for tobacco products [cited 2014 Jul 21]. Available from: www.thecommunityguide.org/tobacco/increasingunitprice.html; and (3) Department of Health and Human Services (US), Substance Abuse and Mental Health Services Administration. National Survey on Drug Use and Health [cited 2015 Jul 21]. Available from: https://nsduhweb.rti.org/respweb/homepage.cfm
