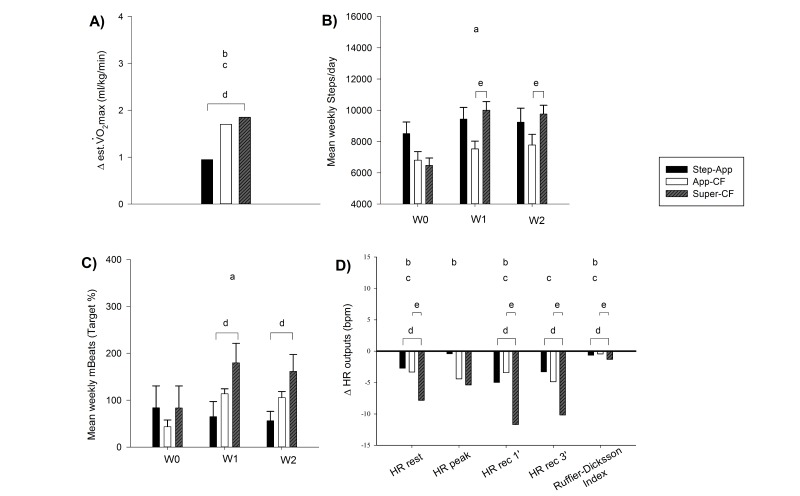
Figure 5.
A) VO2 max week 2 – baseline deltas. B) Mean weekly steps showed for the baseline week 0 (W0), and the two intervention weeks, week 1 (W1), and week 2 (W2). C) Mean weekly mBeats expressed as percentage of target mBeats (for the definition of mBeats see methods section). D) Week 2 - baseline Heart rate (HR) deltas at rest, for the maximal recoded during a squat exercise test (peak), 1 and 3 minutes during the recovery from the squat exercise test, and for the Ruffier-Dickson Index as defined in the method section. a, Significant time x group interaction. b, Significant main effect of time. c, Significant main effect of group. d, Significant difference between Step-App group and Super-CF group. e, Significant difference between CF-App and Super-CF group.

