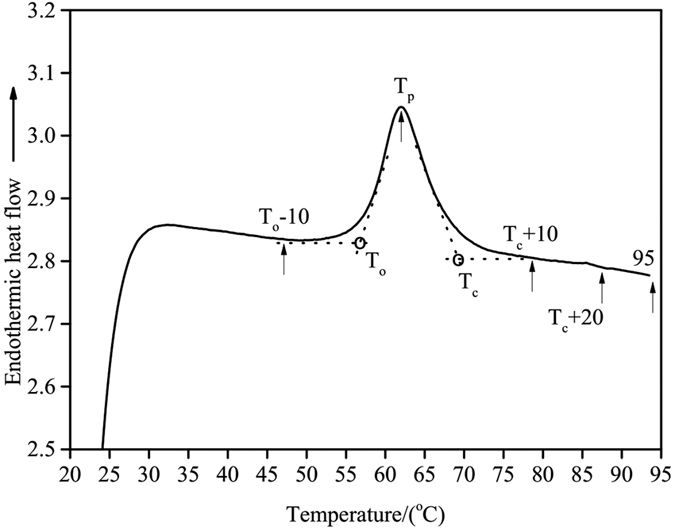
Figure 1. A typical DSC thermogram of a starch-water system with a heating rate of 10 °C/min.

The each letter or number shown on the DSC thermogram represented the end temperature of RVA pre-heating.

The each letter or number shown on the DSC thermogram represented the end temperature of RVA pre-heating.