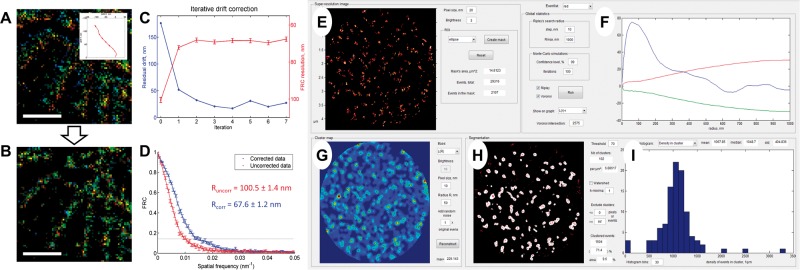
Fig. 1.
Features of SharpViSu. (A, B) 1.5 µm × 1.5 µm fragment of a super-resolution image of β-tubulin in a HeLa cell reconstructed in the color-coded time mode before (A) and after 7 iterations of drift correction (B). The drift trace obtained by SharpViSu is shown in the inset. Scale bars: 500 nm. (C) Reduction of the estimated residual drift (blue) and corresponding improvement of FRC-resolution (red) by iterative drift correction. The curves converge after 2–4 iterations. (D) FRCs of the initial and the corrected datasets show statistically significant improvement in resolution. (E–I) Interface of ClusterViSu, a plugin for comprehensive segmentation of SMLM data. (E) Selected region of interest. (F) Statistics on localizations with Ripley’s L(r)-r functions for the experimental data (blue) and 99% confidence interval for randomly distributed data (red and green) demonstrating statistically significant clustering. (G) Cluster density map calculated on the basis of Ripley’s L(R = 50 nm) function. (H) Cluster map, binarized at the threshold L = 70. (I) Histogram representing distribution of density of localizations in clusters. Data: nucleopore protein TPR, detected with Alexa-647-conjugated secondary antibodies (Lemaître et al., 2014)

