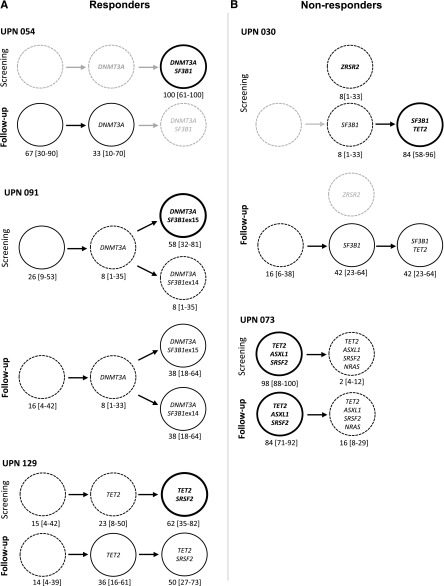
Figure 5.
Genotyping of single HSC–derived colonies. (A) Responders. (B) Nonresponders. Graphic representation of clonal architecture of HSC compartment at the single-cell level before and after 4 cycles of treatment. Percentages of mutated colonies and 95% CIs are indicated for each patient. Bold lines are used for dominant subclones, standard and dotted lines for minor subclones, and gray lines for undetected subclones.

