
FIG 2 .
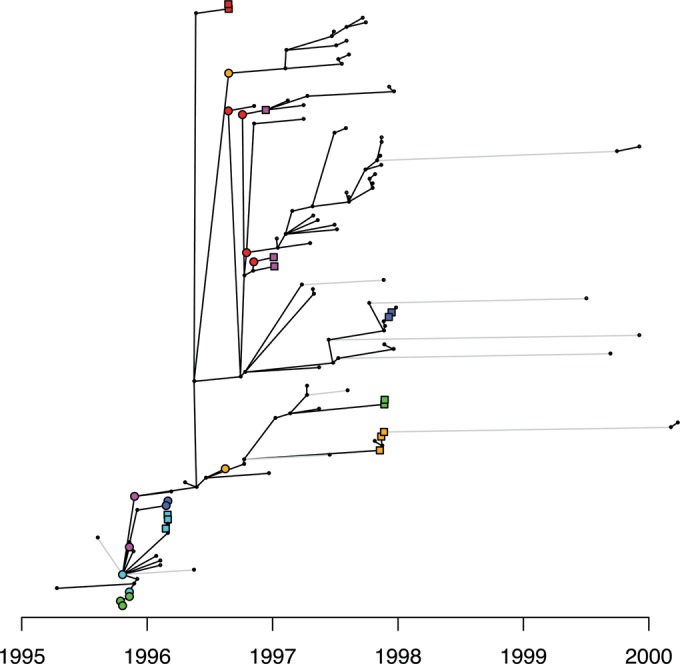
Transmission tree for the Sheffield data set reconstructed using Outbreaker. Cases are indicated by black dots, except for known sexual contacts, who are indicated using the same markers as in Fig. 1. Each case is aligned on the x axis with its reporting date, and the y axis is arbitrary. Black links between cases indicate inferred direct transmission, and gray links indicate indirect transmission through at least one unsampled case.