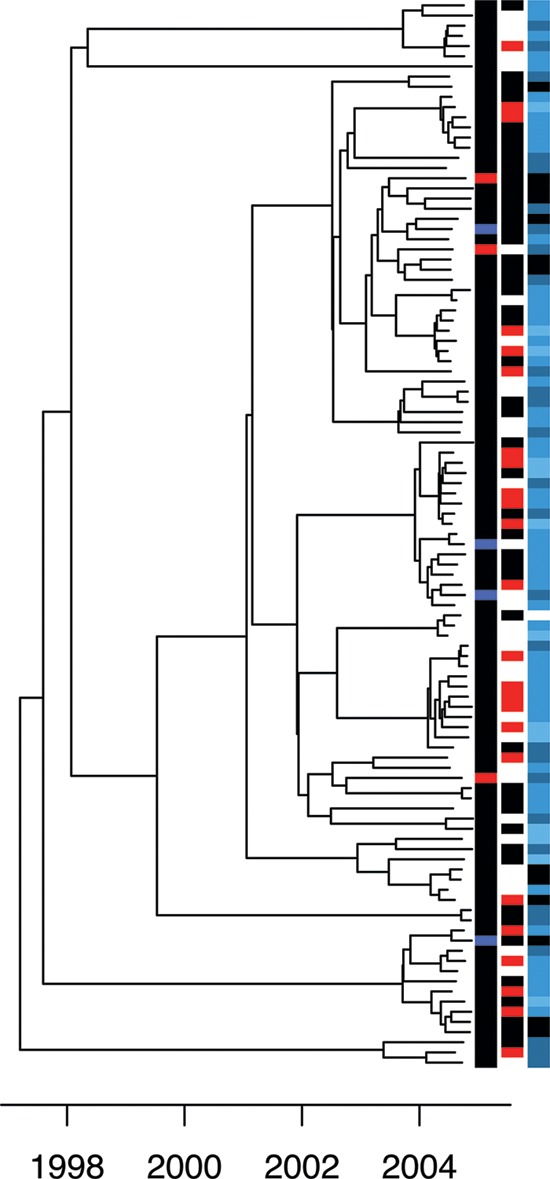
FIG 3 .

Timed phylogeny for the London data set reconstructed using BEAST. Each isolate is annotated on the right-hand side as follows. First column: black for MSM, blue for heterosexual men, and red for heterosexual women. Second column: black for HIV negative and red for HIV positive. Third column: number of reported United Kingdom partners in the last 3 months, with black for zero, gray for one, dark blue for two to five, and light blue for six or more.
