
FIG 4 .
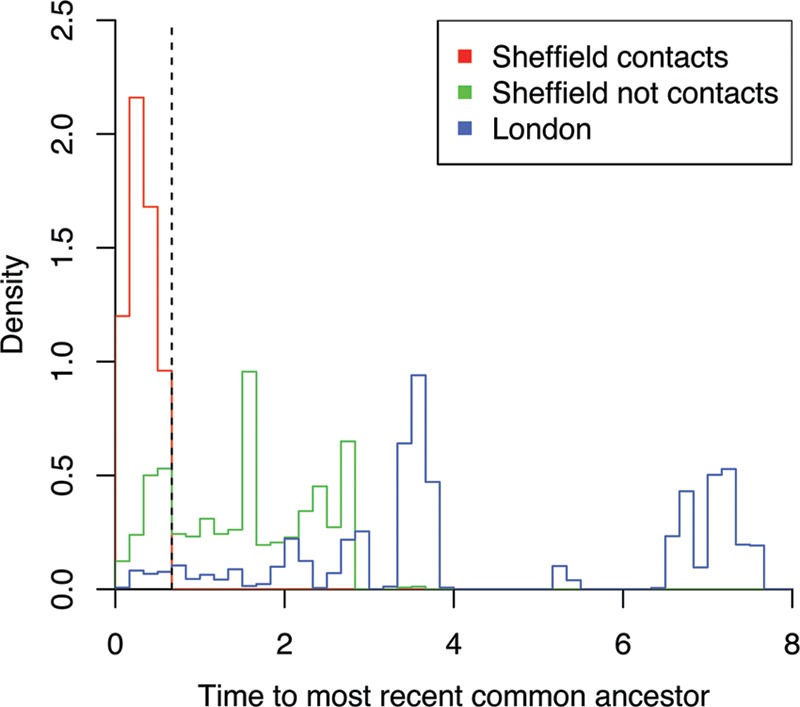
Density histograms of the time to the most recent common ancestor for all pairs of cases sampled within 3 months of each other. The Sheffield data are shown in red when a sexual contact was reported and in green otherwise, whereas the London data are shown in blue.