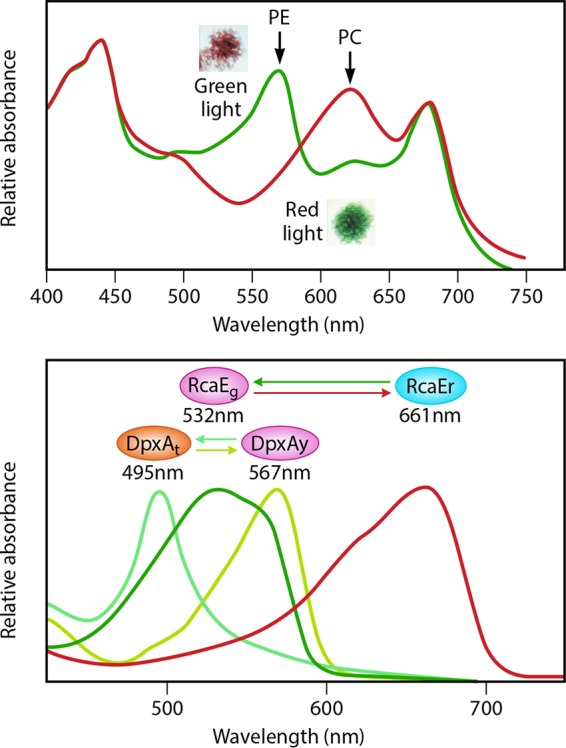
FIG 1 .

(Top) Whole-cell absorption spectra of F. diplosiphon cells. Cells grown in green light accumulate PE and look brick red (inset), while cells grown in red light look green (inset) and accumulate PC. The maximum absorption peaks of PE (λmax, 540 nm) and PC (λmax, 620 nm) are shown by arrows. (Bottom) Absorption spectra of DpxAt (teal; λmax, 495 nm), DpxAy (yellow; λmax, 567 nm), RcaEg (green; λmax, 532 nm), and RcaEr (red; λmax, 661 nm). Ovals represent the different forms of DpxA and RcaE with their peak absorption wavelengths shown below. The interconversion between these forms is shown by colored arrows. The composite figure is adapted and slightly modified (with permission) from figures that appear in references 9 and 14.
