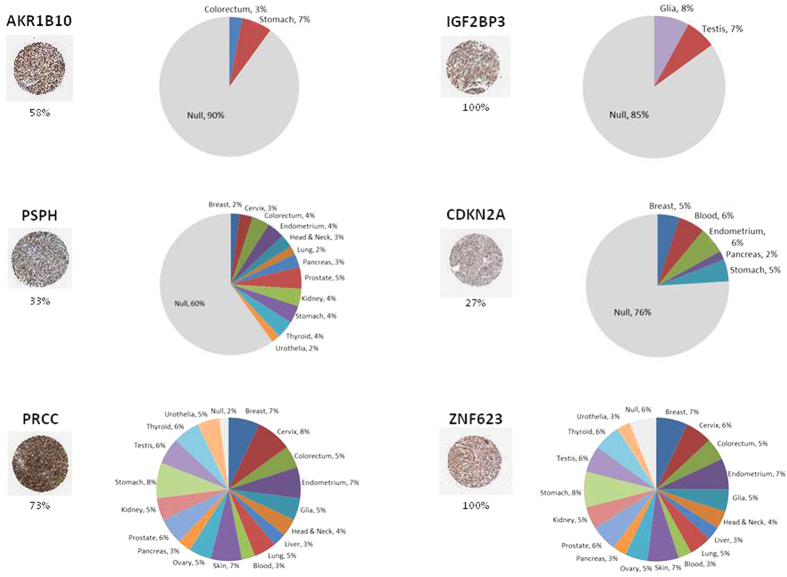
Figure 6. Immunohistochemistry data from The Human Protein Atlas (http://www.proteinatlas.org/).
For each of the proteins shown, the IHC image represents an example of expression in HCC tissues and the percentage of expression in all HCC samples is reported. The pie chart represents the percentage of protein expression by IHC in 20 normal tissues.

