
Figure 5. Begg’s funnel plot for publication bias test under EXO1 rs3754093 (allelic comparison G vs. A).
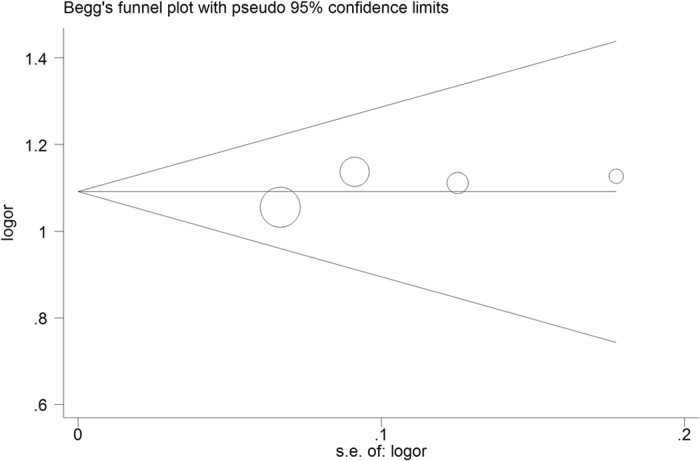
The x-axis is log (OR), and the y-axis is natural logarithm of OR. The horizontal line in the figure represents the overall estimated log (OR). The two diagonal lines indicate the pseudo 95% confidence limits of the effect estimate. Log (OR) = log-transformed OR, OR = odds ratio.