
Figure 3.
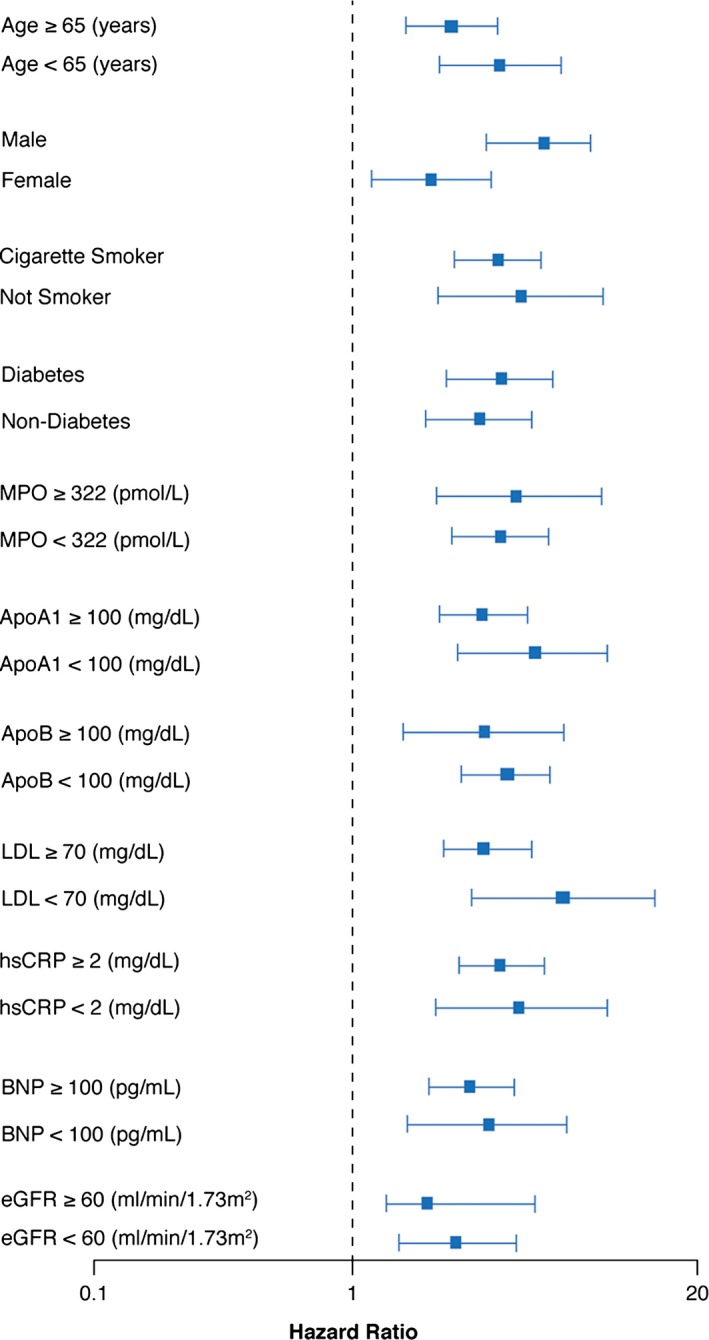
Relationship between plasma TMAO concentration and mortality risk stratified according to clinical and laboratory subgroups. Forest plot of hazard ratio (squares) of 5‐year all‐cause mortality comparing fourth and first quartiles of plasma TMAO levels. Bars represent 95% CIs. ApoA1 indicates apolipoprotein A1; ApoB, apolipoprotein B; BNP, B‐type natriuretic peptide; eGFR, estimated glomerular filtration rate; hsCRP, high‐sensitivity C‐reactive protein; LDL, low‐density lipoprotein; MPO, myeloperoxidase; TMAO indicates trimethylamine‐N‐oxide.