
Figure 1.
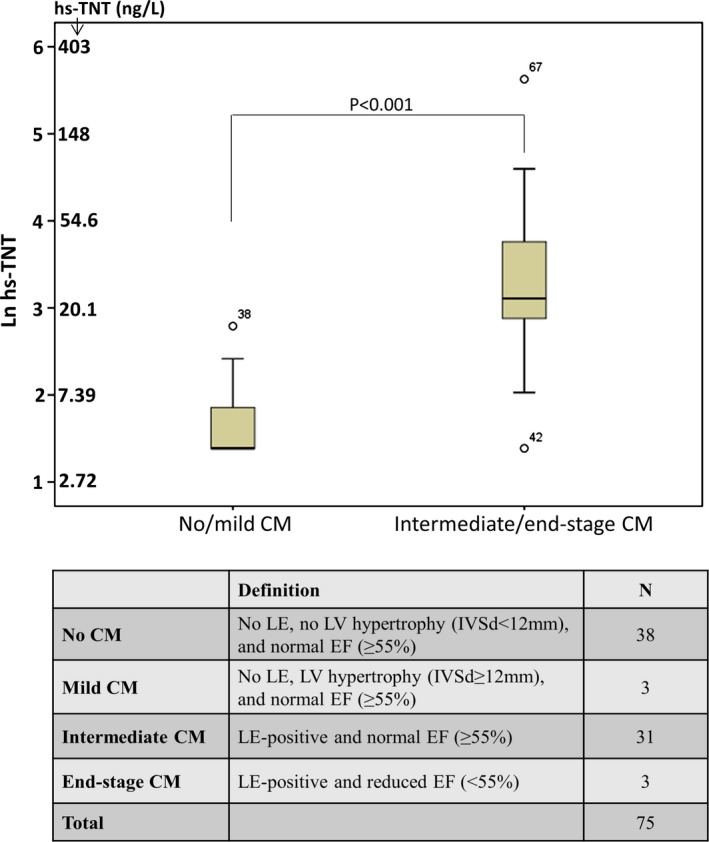
High‐sensitivity cardiac troponin T (hs‐TNT) levels in Fabry patients with different stages of cardiomyopathy (CM). Box plots represent median levels with 25th and 75th percentiles of observed data whereas whiskers indicate the 5th and 95th percentiles in each group. The y‐axis ranges from 1 to 6 representing natural logarithm values of hs‐TNT (Ln hs‐TNT). EF indicates ejection fraction; IVSd, end‐diastolic interventricular septal wall thicknes; LE, late enhancement; LV, left ventricle.