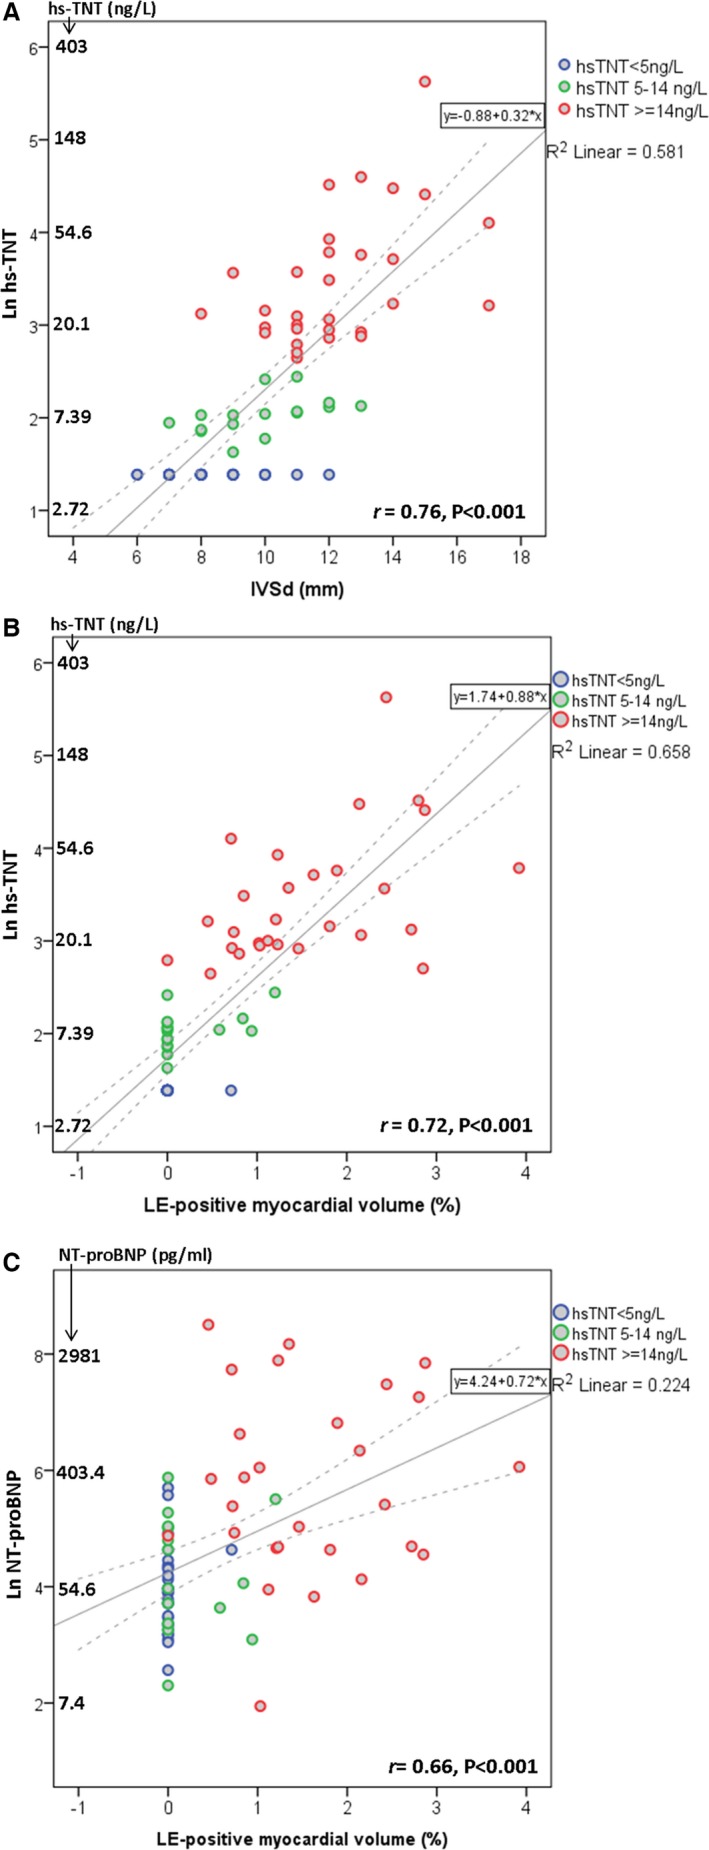
Figure 2.

Scatterplots demonstrating the correlation of (A) high‐sensitivity cardiac troponin T (hs‐TNT) with septal wall thickness (IVSd, mm); (B) hs‐TNT with late enhancement (LE) positive myocardial volume (%); and (C) NT‐proBNP with LE‐positive myocardial volume (%). Natural logarithm (Ln) values of hs‐TNT (A and B) and NT‐proBNP (C) are used as the Y‐axis scale. NT‐proBNP indicates N‐terminal of the prohormone brain natriuretic peptide.
