
Figure 3.
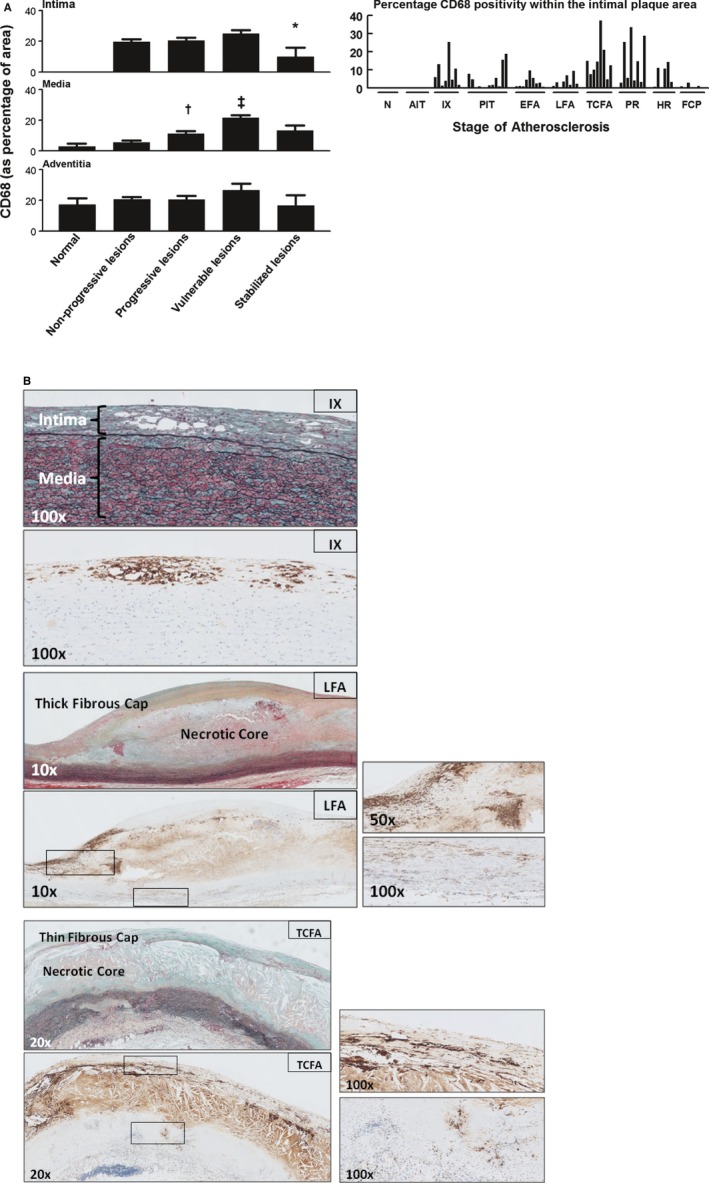
Macrophage (CD68+) distribution in normal, nonprogressive, progressive, vulnerable, and stable atherosclerotic plaques. A, Mean percentage of CD68‐positive area within various regions of interest (intima, media, and adventitia) plotted by lesion morphology (±SEM). An additional plot of the intima illustrates the percentage of CD68 positivity for individual plaque stratified by the stage of atherosclerosis. CD68 is seen from the stage of intimal xanthoma (IX). CD68 positivity increases during disease progression and is maximal for vulnerable plaques, followed by a significant decrease when the lesions stabilize (*P<0.005; compared to vulnerable lesions). CD68 positivity in the media increases with progressive atherosclerotic lesions and vulnerable lesions († P<0.004; ‡ P<0.001; compared to nonprogressive lesions and progressive lesions, respectively) in contrary to the adventitia, which remained relatively constant except for a slight decrease for stabilizing lesions. Spearman's rho correlation coefficient is not significant in the intima, media, and adventitia. B, Representative images of IX, late fibroatheroma (LFA), and a thin‐cap fibroatheroma (TCFA) stained by Movat pentachrome with corresponding immunostain for macrophages (CD68; KP‐1). Macrophages and macrophage foam cells essentially form the IX. The necrotic core in LFA stains highly positive for CD68, representing accumulation of macrophage remnants and therefore was excluded during morphometric analysis. Whereas the thick fibrous cap of the LFA is mainly negative for CD68, the shoulder regions show infiltration by macrophages and macrophage foam cells (see the ×50 magnification) in addition to a notable presence within the media (see the ×100 magnification). More‐advanced TCFAs demonstrate increased macrophage accumulation in the cap. Total number of cases in (A): 85—normal 9, nonprogressive lesions 18 (viz AIT [10] and IX [8]), progressive lesions 29 (viz PIT [12], EFA [9] and LFA [8]), vulnerable lesions 16 (viz TCFA [8] and PR [8]), and stabilized lesions 13 (viz HR [7] and FCP [6]). AIT indicates adaptive intimal thickening; EFA, early fibroatheroma; FCP, fibrotic calcified plaque; HR, healed rupture; N, normal; PIT, pathological intimal thickening; PR, plaque rupture. For a detailed description concerning the classification, see the Material and Methods section.