
Figure 7.
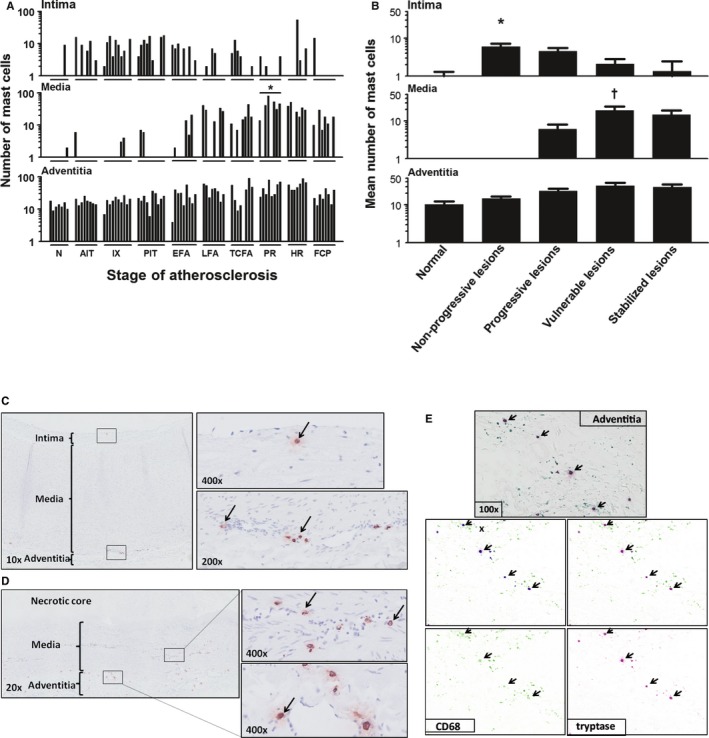
Mast cell (tryptase+) distribution during aortic atherosclerosis. A, Mast cells are constitutively present in the intima and adventitia in the aortic wall. The media practically remains devoid of mast cells until the progressive lesions. Significantly more mast cells are seen in the media of ruptured plaques (*P<0.01; compared to TCFA). B, The highest number of mast cells within the intima is present in the nonprogressive phase (P<0.01) while showing a gradual decrease with lesion progression achieving a minimum for stable fibrocalcific plaques. The media remains almost devoid of mast cells in the normal aorta's and in the nonprogressive lesions, but significantly increases in vulnerable plaques († P<0.0001; compared to progressive lesions) in contrast to adventitial mast cells, which remain relatively stable throughout the atherosclerotic process. C, Representative image of a normal aorta stained for tryptase with high‐resolution images of the intima (×400 magnification) and adventitia (×200 magnification), as indicated by black arrows. Note that adventitial mast cells are scattered and mainly located near vasa vasorum. D, Representative image of a late fibroatheroma with a large necrotic core stained for Tryptase at ×20 magnification with high‐resolution images of media and adventitia at a ×400 magnification. Mast cells are relatively more and remain in close proximity to the vasa vasorum. E, Representative image of the adventitia of an intimal xanthoma double stained for CD68 (Vina Green) and tryptase (Warp Red). CD68‐positive mast cells are identified (arrows), and using the Nuance multispectral imaging system FX, the colocalization can be separately analyzed. Total number of cases in (A and B): 83—normal 7, nonprogressive lesions 18 (viz AIT [8] and IX [10]), progressive lesions 27 (viz PIT [10], EFA [9], and LFA [8]), vulnerable lesions 16 (viz TCFA [8] and PR [8]), and stabilized lesions 15 (viz HR [7] and FCP [8]). In (A), the vertical axis of the intima, media, and adventitia is presented as a log scale. Each solid bar in (A) represents the number of positively stained mast cells within the intima, media, and adventitia of 1 aortic plaque. Large solid bars in (B) represent the mean total number of mast cells within the entire aortic wall per atherosclerotic phase±SEM. For abbreviations and a detailed description concerning the classification, see the Material and Methods section. All sections were developed with diaminobenzidine (DAB) and counterstained with Mayer's hematoxylin. AIT indicates adaptive intimal thickening; EFA, early fibroatheroma; FCP, fibrotic calcified plaque; HR, healed rupture; IX, intimal xanthoma; LFA, late fibroatheroma; N, normal; PIT, pathological intimal thickening; PR, plaque rupture; TCFA, thin cap fibroatheroma.