
Figure 1.
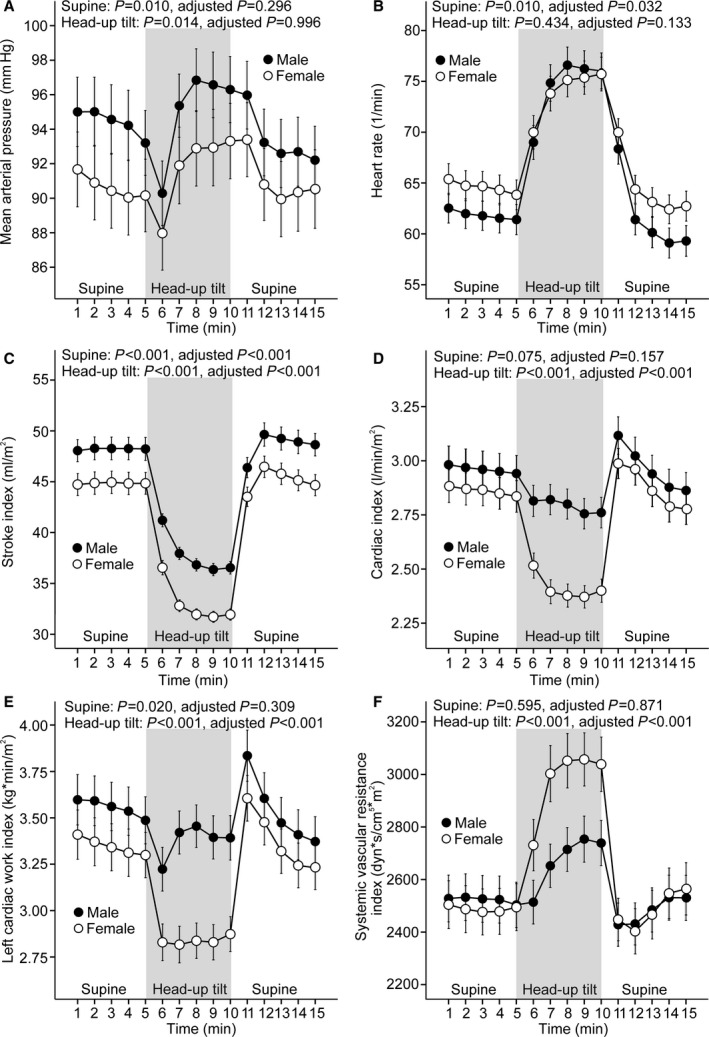
Line graphs show mean arterial pressure (A), heart rate (B), stroke index (C), cardiac index (D), left cardiac work index (E), and systemic vascular resistance index (F) in 167 men and 167 women during supine position and passive head‐up tilt (means and 95% CIs of the mean). P values denote differences between sexes in unadjusted analysis and in analyses adjusted for low‐ and high‐density lipoprotein cholesterol, triglycerides, glucose, mean arterial pressure, smoking habits, alcohol intake, and height.