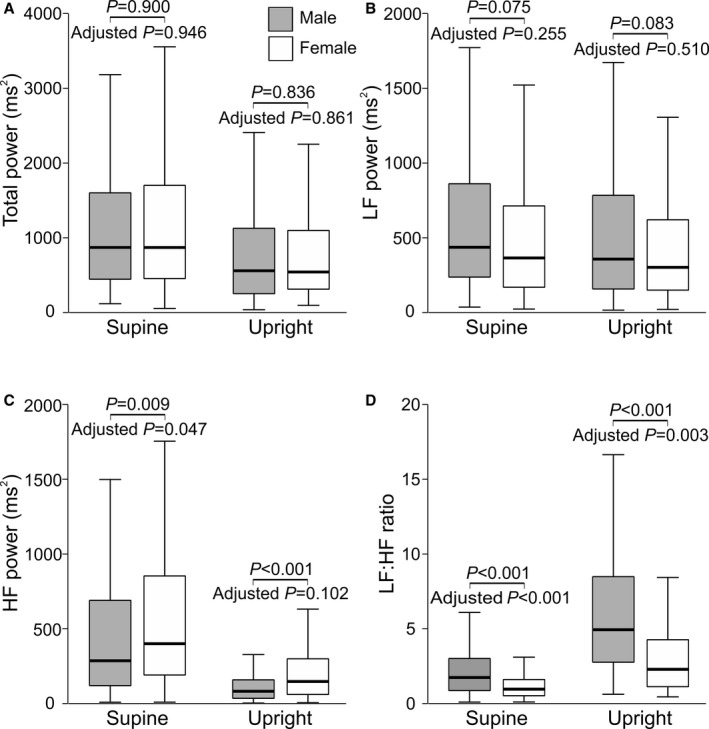
Figure 2.

Box plots of heart rate variability in men and women during 5 minutes in supine and upright positions: total power (A), LF power (B), HF power (C), and LF/HF ratio (D) (median [line inside box], 25th to 75th percentile [box], and range [whiskers); outliers were excluded from the figure but were included in the statistics). P values denote differences between sexes in unadjusted analysis and in analyses adjusted for low‐ and high‐density lipoprotein cholesterol, triglycerides, glucose, heart rate,42 mean arterial pressure, smoking habits, alcohol intake, and height. HR indicates high frequency; LF, low frequency.
