
Figure 4.
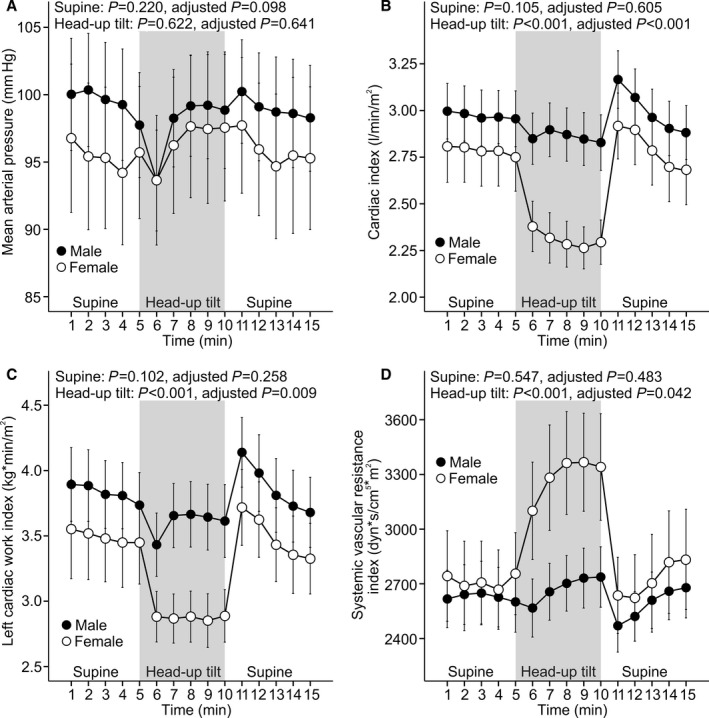
All included participants aged ≥55 years. Line graphs show mean arterial pressure (A), cardiac index (B), left cardiac work index (C), and systemic vascular resistance index (D) in 43 men and 33 women (no hormone replacement therapy in use) during supine position and passive head‐up tilt (means and 95% CIs of the mean). P values denote differences between sexes in unadjusted analysis and in analyses adjusted for low‐ and high‐density lipoprotein cholesterol, triglycerides, glucose, mean arterial pressure, smoking habits, alcohol intake, age, and body mass index.