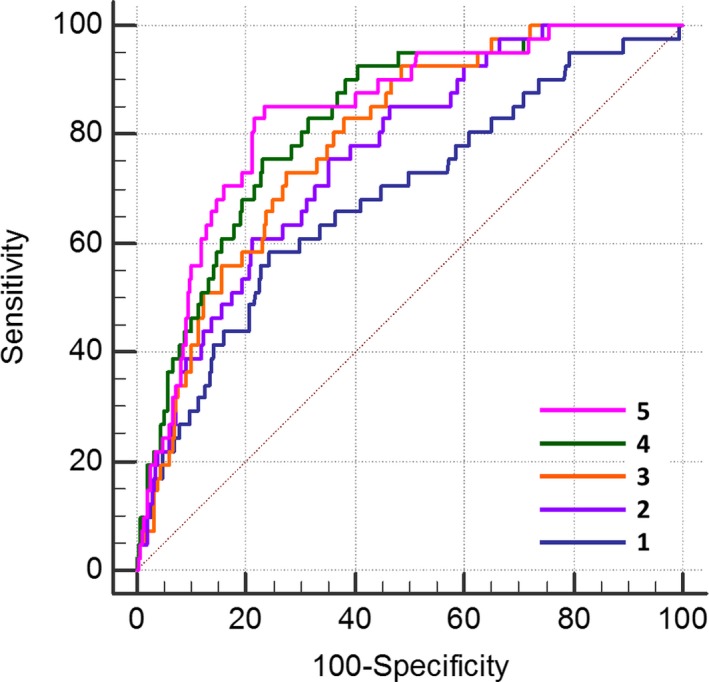
Figure 2.

ROC curves for discrimination of a CHD event. The diagonal represents the line of no discrimination. The curves represent the predictive probability of the following: 1. UKPDS CHD risk score alone (C=0.683); 2. the latter plus CAC score (C=0.763, P=0.020); 3. the latter plus plaque burden (C=0.789, P=0.034); 4. the latter plus the Gensini angiographic score (C=0.824, P=0.021); and 5. the latter plus maximal plaque burden and segment involvement score (C=0.836, P=0.35) (all P values vs immediately previously mentioned ROC curve). Both the CTA‐derived plaque burden and the Gensini score improved outcome discrimination over the combination of the UKPDS CHD risk score and CAC score. CAC indicates coronary artery calcium; CHD, coronary heart disease; CTA, computed tomography angiography; ROC, receiver operator‐characteristic; UKPDS, United Kingdom Prospective Diabetes Study.
