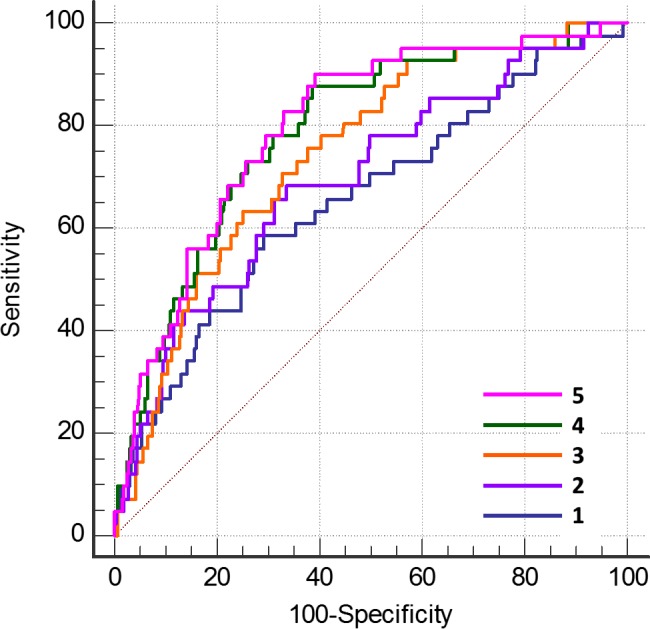
Figure 4.

ROC curves for discrimination of a CHD event in patients with coronary artery plaque (N=500). The diagonal represents the line of no discrimination. Addition of each CTA‐derived variable to the combined predictive probability successively improved the C statistic. 1. UKPDS CHD risk score (C=0.655); 2. the latter plus CAC score combined (C=0.697, P=0.177); 3. the latter plus plaque burden (C=0.743, P=0.035); 4. the latter plus the Gensini angiographic score (C=0.782, P=0.040); and 5. the latter plus mild plaque calcification (C=0.798, P=0.45 vs 4 above, P=0.012 vs 2 above) (all other P values vs immediately prior ROC curve). CAC indicates coronary artery calcium; CHD, coronary heart disease; CTA, computed tomography angiography; ROC, receiver operator characteristic; UKPDS, United Kingdom Prospective Diabetes Study.
