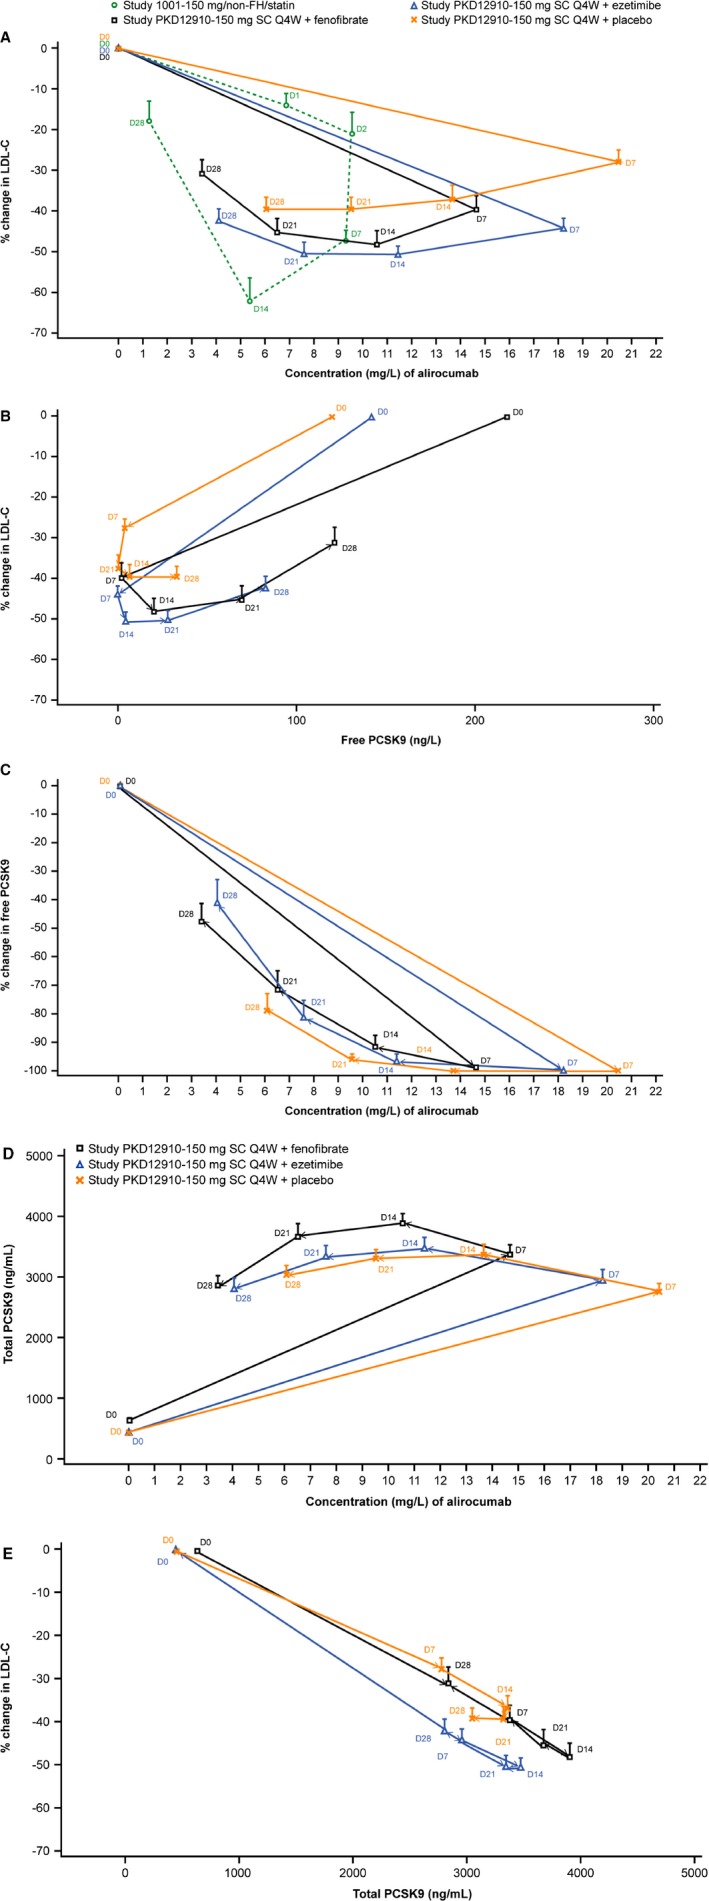
Figure 6.

Hysteresis plots comparing changes over time in LDL‐C vs alirocumab (A) and vs free PCSK9 (B), free PCSK9 vs alirocumab (C), total PCSK9 vs alirocumab (D) and LDL‐C vs total PCSK9 (E). Study variables are plotted on x and y axes with data points representing sample time points (day 0–28 following administration of alirocumab). In the key in (A) “PKD12910” refers to the current study; (A) also includes data from alirocumab Phase I study 1001 for comparison. D indicates study day relative to administration of alirocumab; LDL‐C, low‐density lipoprotein cholesterol; non‐FH, non‐familial hypercholesterolemia; PCSK9, proprotein convertase subtilisin/kexin 9; Q4W, every 4 weeks; SC, subcutaneous.
