
Figure 3.
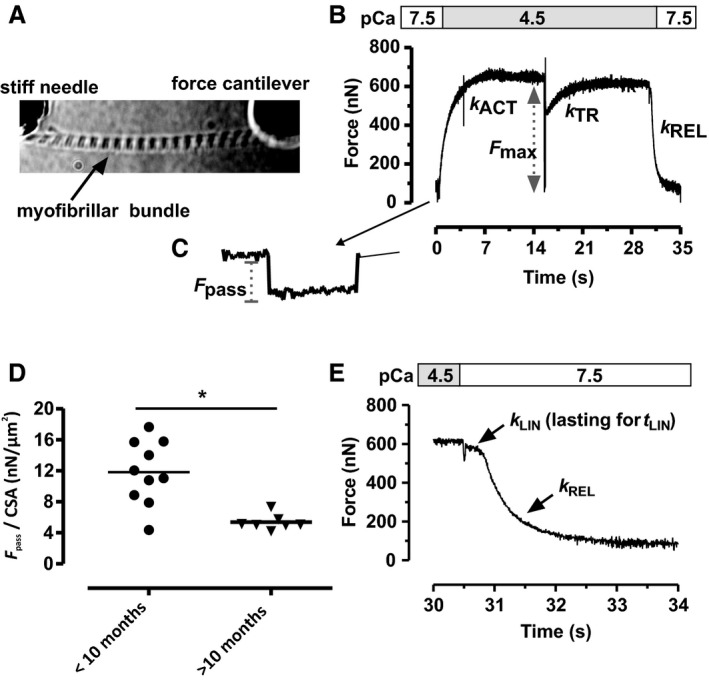
Force transients and passive force of right ventricular myofibrillar bundles. A, Image of a mounted myofibrillar bundle. B, Representative contraction–relaxation transient induced by switching (within 10 ms) from pCa 7.5 to 4.5 and back. Raising [Ca2+] and a release–restretch maneuver applied at the force plateau result in monoexponential force development with respective rate constants k ACT and k TR. C, Passive force per cross‐sectional area (F pass/CSA) at 2.3 μm SL was determined before activation by slackening the myofibril by 20% of slack length. D, F pass/CSA was significantly higher (*P<0.05) in younger (aged <10 months) than in older (>10 months) infants. E, Switching pCa back 7.5 leads to a biphasic relaxation that was fitted by a biphasic function (Methods) yielding k LIN, t LIN, and k REL.