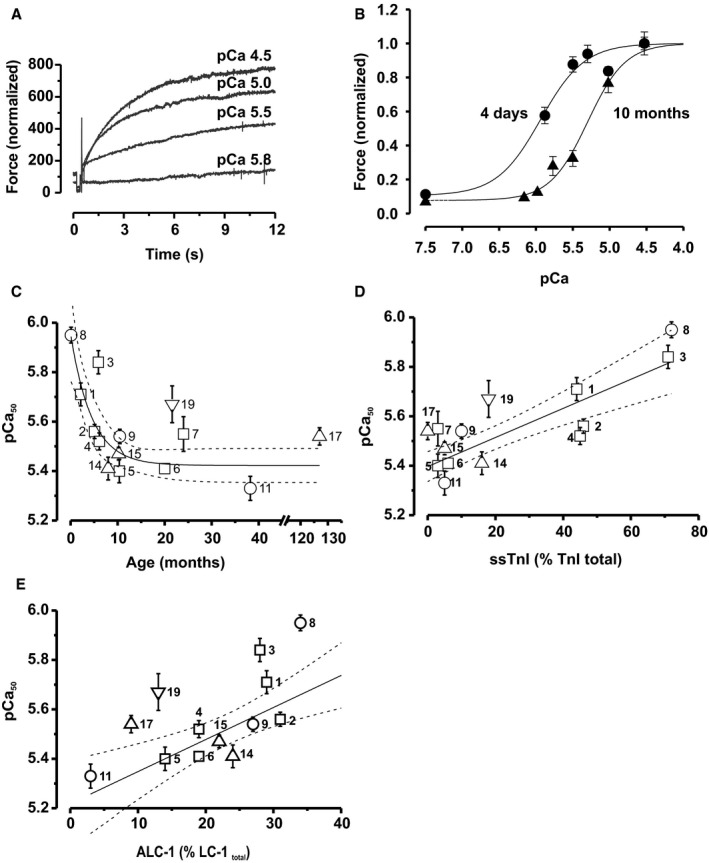
Figure 4.

Postnatal change in Ca2+ sensitivity of force development. A, Original force tracings of contractions elicited by the indicated pCa values. B, Force–pCa relations collected from 5 myofibril bundles of a newborn (patient No. 8) and 6 myofibril bundles of a 10‐month‐old child (patient No. 5), illustrating the representative rightward shift with this increase of age. The curves represent Hill functions fitted to the data, which were normalized to F max at pCa 4.5. C, pCa50 declines monoexponentially with age (r 2=0.59, P<0.05). D and E, pCa50 positively correlated with ssTnI (r 2=0.81, P<0.0001) and ALC‐1 (r 2=0.62, P<0.05) expression. Solid and dotted lines represent the monoexponential (C) and linear fits (D and E) and the respective 95% confidence limits. The pCa50 values were determined from 2 to 12 myofibrils per patient and are given as mean±SEM. Symbols in (C through E): tetralogy of Fallot, open squares; pulmonary atresia, open circles; pulmonary stenosis, open upward triangles; double‐outlet right ventricle, open downward triangles. Each symbol represents 1 patient, and numbers are patient numbers from Table S1.
