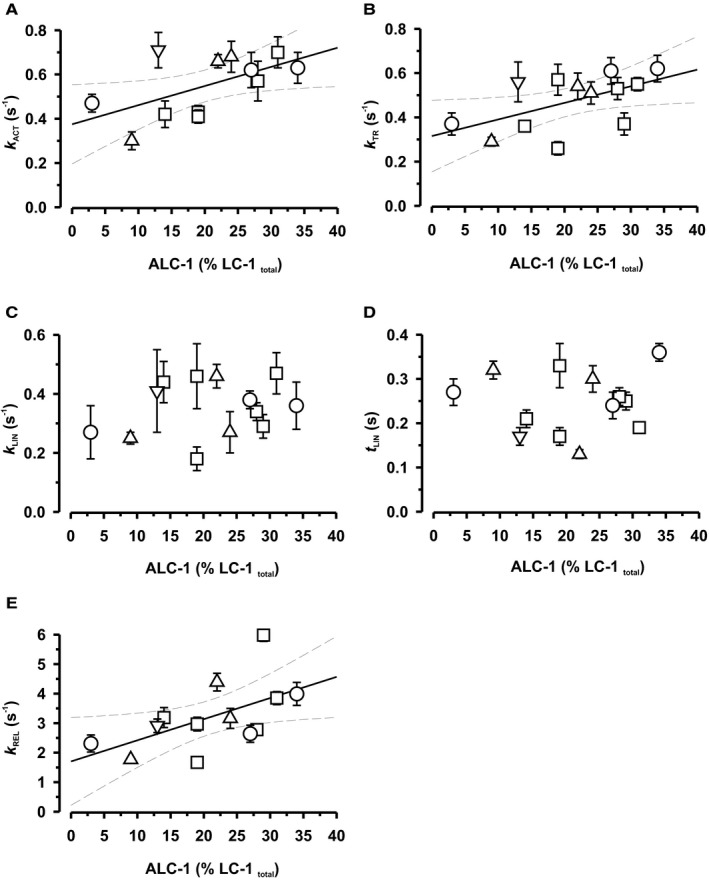
Figure 6.

Effect of ALC‐1 expression on kinetic parameters of contraction and relaxation. A, Rate constant of Ca2+‐induced force development; B, Rate constant of mechanically‐induced force development; C, Rate constant of initial slow linear relaxation phase; D, Duration of initial slow linear relaxation phase; E, Rate constant of subsequent rapid exponential relaxation phase. For determination of rate constants of contraction (k ACT and k TR) and relaxation (k LIN, t LIN, k REL), cf. Figure 3. Symbols: tetralogy of Fallot, open squares; pulmonary atresia, open circles; pulmonary stenosis, open upward triangles; double‐outlet right ventricle, open downward triangles. Each symbol represents the mean±SEM of 2 to 12 myofibrils of a patient. Solid and dotted lines represent linear correlations and 95% confidence limits (Pearson correlation coefficients: A, r 2=0.58, P<0.05; B, r 2=0.55, P<0.05; E, r 2=0.57, P<0.05).
